
Page 142 - 《水产学报》2025年第7期
P. 142
刘啟庆,等 水产学报, 2025, 49(7): 079511
测试区域 Y 轴/m Y axis of test area 0.2 测试区域 Y 轴/m Y axis of test area 0.2
0.3 0.3
0.1
0.1
0
0.6
0.8
0
0.2
0.4
0.4
0.8
0.6
测试区域 X 轴/m 1.0 1.2 0 0 0.2 测试区域 X 轴/m 1.0 1.2
X axis of test area X axis of test area
(a) 0.3 (b)
测试区域 Y 轴/m Y axis of test area 0.2 测试区域 Y 轴/m Y axis of test area 0.2
0.3
0.1
0.1
0
0.8
0.6
0.4
0.6
0.8
0
0.4
0.2
测试区域 X 轴/m 1.0 1.2 0 0 0.2 测试区域 X 轴/m 1.0 1.2
X axis of test area X axis of test area
(c) 0.3 (d)
测试区域 Y 轴/m Y axis of test area 0.2 测试区域 Y 轴/m Y axis of test area 0.2
0.3
0.1
0.1
0
0.2
0.6
0.4
0.8
0
0.4
0.8
0.6
测试区域 X 轴/m 1.0 1.2 0 0 0.2 测试区域 X 轴/m 1.0 1.2
X axis of test area X axis of test area
(e) (f)
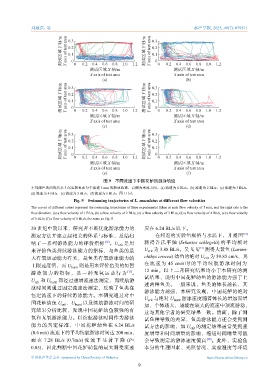
图 9 不同流速下中国花鲈的游泳轨迹
不同颜色的曲线代表 3 尾实验鱼在每个流速 5 min 的游泳轨迹,右侧为来流方向。(a) 流速为 1 BL/s,(b) 流速为 2 BL/s,(c) 流速为 3 BL/s,
(d) 流速为 4 BL/s,(e) 流速为 5 BL/s,(f) 流速为 6 BL/s,图 11 同。
Fig. 9 Swimming trajectories of L. maculatus at different flow velocities
The curves of different colors represent the swimming trajectories of three experimental fishes at each flow velocity of 5 min, and the right side is the
flow direction. (a) a flow velocity of 1 BL/s, (b) a flow velocity of 2 BL/s, (c) a flow velocity of 3 BL/s, (d) a flow velocity of 4 BL/s, (e) a flow velocity
of 5 BL/s, (f) a flow velocity of 6 BL/s, the same as Fig.11.
20 世纪中期以来,研究者不断优化游泳能力的 应在 6.24 BL/s 以下。
测定方法并建立起相关的体系与标准,总结归 在相近的实验鱼规格与水温下,井爱国 [14]
纳了一系列游泳能力的评价指标 [12] 。U cri t 是用 测得许氏平鲉 (Sebastes schlegelii) 的平均相对
来评价鱼类持续游泳能力的指标,与鱼类的最 U cri t 为 3.88 BL/s。吴飞飞 [15] 测得大黄鱼 (Larimi-
大有氧运动能力有关,是鱼类有氧游泳能力的 chthys crocea) 幼鱼的绝对 U cri t 为 39.85 cm/s,其
在 流 速 为 45 cm/s 时 的 平 均 续 航 游 泳 时 间 为
上限速度值,而 U burs t 则是用来评价鱼类的短暂
游 泳 能 力 的 指 标 , 是 一 种 无 氧 运 动 行 为 [13] 。 12 min。以上二者研究结果均小于本研究的测
试结果,说明中国花鲈幼鱼的游泳能力强于上
U cri t 和 U burs t 都经过递增流速法测定,而续航游 述两种鱼类。一般来说,鱼类的体长越长,其
泳时间则通过固定流速法测定,反映了鱼类在
游泳能力越强,本研究发现,中国花鲈的绝对
恒定流速下的持续游泳能力。本研究通过对中
U cri t 与绝对 U burs t 游泳速度随着体长的增加而增
国花鲈幼鱼 U 、U burs t 以及续航游泳时间的研 加,个体越大,越能在较大的流速中顶流游动,
crit
究结果分析比较,发现中国花鲈幼鱼较强的有
这与其他学者的研究结果一致。然而,除了测
氧和无氧游泳能力。以续航游泳时间作为游泳 试鱼种导致的差异,鱼类游泳能力还会受到测
能力的判定标准,中国花鲈幼鱼在 6.24 BL/s 试方法的影响,如 U cri t 的测定结果通常受到速
(0.6 m/s) 流速下的平均续航游泳时间达 200 min, 度增量和时间增量的影响,缩短时间增量可能
而 在 7.28 BL/s (0.7m/s) 流 速 下 显 著 下 降 (P< 会导致测定的游泳速度偏高 。此外,实验鱼
[16]
0.05),因此判断中国花鲈幼鱼的最大耐受流速 本身的生理因素、光照情况、实验温度等环境
中国水产学会主办 sponsored by China Society of Fisheries https://www.china-fishery.cn
9