
Page 141 - 《水产学报》2025年第7期
P. 141
刘啟庆,等 水产学报, 2025, 49(7): 079511
表 2 中国花鲈绝对 U burs 与 t 14 个形态特征的相关性
Tab. 2 Correlation between absolute U burst and 14 morphological traits of L. maculatus
Pearson
形态特征 尾数/尾 长度/cm 最大值/cm 最小值/cm F值 P值
traits number length maximum value minimum value 相关性系数 F value P value
Pearson relation
体长 body length 25 9.43±0.66 10.68 8.19 0.72 23.17 <0.001
尾长 tail length 25 3.18±0.30 3.58 2.58 0.71 22.50 <0.001
躯干长 trunk length 25 3.33±0.27 3.80 2.76 0.69 20.12 <0.001
全长 total length 25 11.18±0.68 12.43 9.89 0.69 20.05 <0.001
体高 body height 25 2.29±0.21 2.83 1.93 0.69 19.69 <0.001
尾柄高 tail handle height 25 0.82±0.11 1.07 0.59 0.68 19.06 <0.001
尾柄长 tail handle length 25 2.01±0.18 2.35 1.67 0.63 14.80 <0.001
臀鳍长 buttock fin length 25 1.65±0.17 1.91 1.23 0.60 12.65 0.002
头长 head length 25 2.89±0.21 3.30 2.52 0.58 11.36 0.003
胸鳍长 pectoral fin length 25 1.51±0.16 1.75 1.15 0.50 7.22 0.013
第一背鳍长 first dorsal fin length 25 1.53±0.10 1.72 1.40 0.36 3.18 0.089
第二背鳍长 second dorsal fin length 25 1.96±0.24 2.32 1.56 0.33 2.69 0.115
腹鳍长 ventral fin length 25 1.56±0.16 1.87 1.15 0.30 2.10 0.162
尾鳍长 caudal fin length 25 1.75±0.10 1.94 1.55 0.24 1.33 0.262
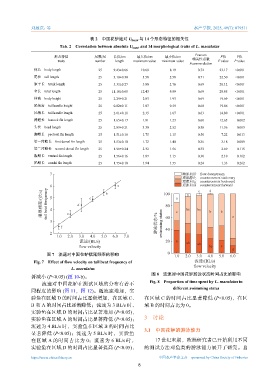
7 顺流向后`float downstream
逆流静止`countercurrent stationary
逆流向后`countercurrent backward
6 b a 100 逆流向前`countercurrent forward
d
摆尾频率/(次/s) tail beat frequency 5 4 d c 80 a c bc bc b b
c
b
3 e 游泳状态/% swimming states 60 a
f 40
2
1.0 2.0 3.0 4.0 5.0 6.0 7.0
流速/(BL/s) 20 a ab ab
flow velocity bc c d
图 7 流速对中国花鲈摆尾频率的影响 0 1.0 2.0 3.0 4.0 5.0 6.0
Fig. 7 Effect of flow velocity on tail beat frequency of 流速/(BL/s)
flow velocity
L. maculatus
图 8 流速对中国花鲈游泳状态时间占比的影响
著减小 (P<0.05) (图 10-b)。
流速对中国花鲈在测试区域的分布有着不 Fig. 8 Proportion of time spent by L. maculatus in
different swimming states
同程度的影响 (图 11,图 12)。随流速增加,实
验鱼在区域 D 的时间占比逐渐增加,在区域 C、 在区域 C 的时间占比显著降低 (P<0.05),在区
B 和 A 的时间占比逐渐降低;流速为 3 BL/s 时, 域 B 的时间占比为 0。
实验鱼在区域 D 的时间占比显著增加 (P<0.05),
实验鱼在区域 A 的时间占比显著降低 (P<0.05); 3 讨论
流速为 4 BL/s 时,实验鱼在区域 B 的时间占比
3.1 中国花鲈的游泳能力
显著降低 (P<0.05);流速为 5 BL/s 时,实验鱼
在区域 A 的时间占比为 0;流速为 6 BL/s 时, 17 世纪末期,欧洲研究者已开始利用不同
实验鱼在区域 D 的时间占比显著提高 (P<0.05), 的测试方法对鱼类的游泳能力展开了研究。自
https://www.china-fishery.cn 中国水产学会主办 sponsored by China Society of Fisheries
8