
Page 144 - 《水产学报》2025年第7期
P. 144
刘啟庆,等 水产学报, 2025, 49(7): 079511
密度 密度
density 0.3 density
测试区域 Y 轴/m Y axis of test area 0.2 D C B A 66.5 测试区域 Y 轴/m Y axis of test area 0.2 D C B A 38.9
51.8
0.3
88.6
45.3
77.5
32.4
55.4
44.3
25.9
19.4
33.2
0.1
0.1
13.0
22.2
11.1
6.5
0
0.6
0.4
0.8
0.2
0
测试区域 X 轴/m 1.0 1.2 0 0 0 0.2 0.4 0.6 0.8 1.0 1.2 0
测试区域 X 轴/m
X axis of test area X axis of test area
(a) (b)
密度 密度
density 0.3 density
测试区域 Y 轴/m Y axis of test area 0.2 D C B A 172.5 测试区域 Y 轴/m Y axis of test area 0.2 D C B A 67.9
0.3
90.5
230.0
201.3
79.2
143.8
56.6
115.0
45.3
86.3
34.0
0.1
0.1
57.5
22.6
28.8
11.3
0
0.8
0.4
0
0.2
0.6
测试区域 X 轴/m
测试区域 X 轴/m 1.0 1.2 0 0 0 0.2 0.4 0.6 0.8 1.0 1.2 0
X axis of test area X axis of test area
(c) 密度 (d) 密度
density 0.3 density
测试区域 Y 轴/m Y axis of test area 0.2 D C B A 197.3 测试区域 Y 轴/m Y axis of test area 0.2 D C B A 418.5
0.3
558.0
263.0
230.1
488.3
164.4
348.8
131.5
279.0
209.3
98.6
0.1
0.1
65.8
139.5
69.8
32.9
0
0.2
0.8
0.6
0.4
0
测试区域 X 轴/m
测试区域 X 轴/m 1.0 1.2 0 0 0 0.2 0.4 0.6 0.8 1.0 1.2 0
X axis of test area X axis of test area
(e) (f)
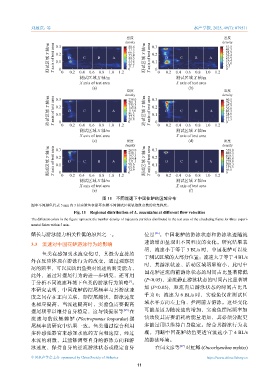
图 11 不同流速下中国花鲈的区域分布
图中不同颜色代表 5 min 内 3 尾实验鱼在循环水槽不同测试区域轨迹质点数的密集程度。
Fig. 11 Regional distribution of L. maculatus at different flow velocities
The different colors in the figure represent the number density of trajectory particles distributed in the test area of the circulating flume for three experi-
mental fishes within 5 min.
[26]
鳍长与游泳能力相关性低的原因之一。 位置 。中国花鲈的游泳状态和游泳轨迹随流
速的增加呈现出不同程度的变化。研究结果表
3.3 流速对中国花鲈游泳行为的影响
明,流速小于等于 3 BL/s 时,中国花鲈可以处
鱼类在感知到水流变化时,其最为直接的
于测试区域的大部分位置;流速大于等于 4 BL/s
外在反应体现在游泳行为的改变,通过观察摆
时,其游泳轨迹、活动区域明显缩小,此时中
尾的频率,可以反映出鱼类对流速的耐受能力,
国花鲈逆流向前游泳状态的时间占比显著降低
此外,通过对摆尾行为的进一步研究,还可用
(P<0.05),逆流静止游泳状态的时间占比显著增
于分析不同流速环境下鱼类的游泳行为策略 。
[1]
加 (P<0.05),顺流向后游泳状态的时间占比几
本研究表明,中国花鲈的摆尾频率与其游泳速
乎为 0;流速为 6 BL/s 时,实验鱼仅在测试区
度之间存在正向关联,即摆尾越快,游泳速度
也相应提高,当流速提高时,实验鱼需要提高 域水平方向左上角、拦网前方游泳。这些变化
摆尾频率以维持自身稳定,这与钱振家等 [25] 在 可能是因为随流速的增加,实验鱼摆尾频率加
流速与豹纹鳃棘鲈 (Plectropomus leopardus) 摆 快致使其需要消耗的能量增加,其必须分配更
尾频率的研究中结果一致。鱼类通过综合利用 多能量用以维持自身稳定。综合其游泳行为表
多种感觉器官来感知水流的方向和速度,经过 现,判断中国花鲈幼鱼更适宜流速小于 4 BL/s
水流的刺激,其能够调整自身的游泳方向和游 的游泳环境。
泳速度,保持自身的逆流游泳状态或稳定自身 在闫文彦等 [27] 对虹鳟 (Oncorhynchus mykiss)
中国水产学会主办 sponsored by China Society of Fisheries https://www.china-fishery.cn
11