
Page 131 - 《摩擦学学报》2021年第5期
P. 131
720 摩 擦 学 学 报 第 41 卷
测分析,试验和仿真计算结果见表6. 由表6可知,疲劳 痕轮廓尺寸预测值和试验值相对误差均小于6.5%,这
周次5 000时疲劳钢丝椭圆状磨痕轮廓尺寸预测值和 表明疲劳钢丝微动磨损预测值和试验值吻合较好.
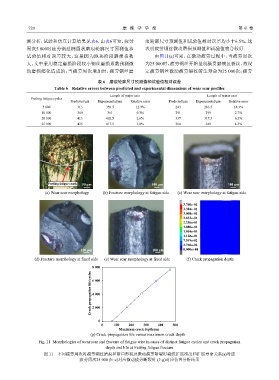
试验值相对误差较大,这是因为跑和阶段磨损系数 由图11(a)可知,在微动疲劳过程中,当疲劳周次
大,文中采用稳定磨损阶段较小钢丝磨损系数预测微 为25 000时,疲劳钢丝开始呈现横贯磨痕区裂纹,故设
动磨损演化造成的;当疲劳周次增加时,疲劳钢丝磨 定疲劳钢丝微动疲劳裂纹萌生寿命为25 000次;疲劳
表 6 磨痕轮廓尺寸预测值和试验值相对误差
Table 6 Relative errors between predicted and experimental dimensions of wear scar profiles
Length of major axis Length of minor axis
Fretting fatigue cycles
Predicted/μm Experimental/μm Relative error Predicted/μm Experimental/μm Relative error
5 000 313 359.5 12.9% 243 283.5 14.3%
10 000 360 361 0.3% 291 299 2.7%
20 000 413 402.5 2.6% 337 317.5 6.1%
25 000 425 417.5 1.8% 364 349 4.3%
Fretting fatigue crack 50 μm 100 μm 100 μm
(a) Wear scar morphology (b) Fracture morphology at fatigue side (c) Wear scar morphology at fatigue side
3.760e-01
3.384e-01
3.008e-01
2.632e-01
2.256e-01
1.880e-01
1.504e-01
1.128e-01
7.519e-02
3.760e-02
100 μm 100 μm 0.000e+00
(d) Fracture morphology at fixed side (e) Wear scar morphology at fixed side (f) Crack propagation depth
8 000
Crack propagation life/cycles 6 000
4 000
2 000
0
0 100 200 300 400 500
Maximum crack depth/μm
(g) Crack propagation life versus maximum crack depth
Fig. 11 Morphologies of wear scar and fracture of fatigue wire in cases of distinct fatigue cycles and crack propagation
depth and life at fretting fatigue fracture
图 11 不同疲劳周次时疲劳钢丝磨痕和断口形貌及微动疲劳断裂时裂纹扩展深度和扩展寿命关系(a)对应
疲劳周次25 000 (b~e)对应微动疲劳断裂时 (f~g)对应仿真分析结果