Page 74 - 《摩擦学学报》2021年第1期
P. 74

第 1 期                      王美琪, 等: 基于SQPSO优化DELM的踏面磨耗测量模型                                     71

                   表 2    曲线半径对踏面磨耗最大值的影响                      况. 对这些性能参数的具体分析如下.
                 Table 2    Influence of curve radius on maximum                   v    Q
                                                                                   t
                             tread wear value                                        1  ∑       2
                                                                           RMSE =         (y i − ˆy i )  (15)

              Speed  Curve radius  Axle load  Maximum wear depth value               Q  i=1
               20      600       25         1.105 579 734
                                                                                       Q
               20      800       25         0.941 803 038                           1  ∑
                                                                             MAE =       |y i − ˆy i |   (16)
               20      1 000     25         0.759 192 765                           Q
                                                                                       i=1
               20      1 200     25         0.712 176 025
               20      1 400     25         0.544 970 036                           Q
                                                                                 1  ∑
               20      2 000     25         0.564 393 461                 MAPE=        y i − ˆy i   ×100%  (17)

                                                                                 Q      y i
               20      5 000     25         0.621 851 742                          i=1
               20      8 000     25         0.653 806 686
                                                                             MAXE = max|y i − ˆy i |     (18)
               20      9 000     25         0.652 401 567
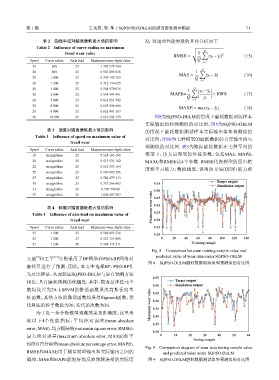
               20     10 000     25         0.616 302 133          图8为SQPSO-DELM的情况下磨耗数据训练样本
                                                               实际输出值和预测值的对比图,图9为SQPSO-DELM
                     表 3    速度对踏面磨耗最大值的影响                      的情况下磨耗数据测试样本实际输出值和预测值的
                Table 3    Influence of speed on maximum value of
                                                               对比图,图10为七种模型的磨耗数据的真实输出值与
                               tread wear
                                                               预测值的对比图. 表5为踏面磨耗数据在七种不同的
              Speed  Curve radius  Axle load  Maximum wear depth value
               18    straight line  25      0.528 163 195      模型下,仿真后得到的性能参数,包括MAE、MAPE、
               20    straight line  25      0.513 535 142      MAXE和RMSE这4个参数. RMSE代表模型的回归精
               22    straight line  25      0.515 395 164
                                                               度和学习能力,数值越低,说明该方法的回归能力和
               25    straight line  25      0.509 085 536
               27    straight line  25      0.564 479 113
                                                                                              Target output
               30    straight line  25      0.757 266 462          0.55
                                                                                              Simulation output
               33    straight line  25      0.750 790 06           0.50
                                                                  Maximum wear value  0.40
               55    straight line  25      1.024 407 387          0.45
                     表 4    轴重对踏面磨耗最大值的影响
               Table 4    Influence of axle load on maximum value of  0.35
                               tread wear                          0.30

              Speed  Curve radius  Axle load  Maximum wear depth value  0.25
               25      1 200     25         0.509 085 536
                                                                   0.20
               25      1 200     27         0.523 155 808             0    20   40   60   80   100  120  140
               25      1 200     30         0.588 173 211                          Training sample

                                                                  Fig. 8    Comparison between training sample value and
                        [13]
                 [9]
            文健 和王平 分别采用了BP网络和PSO-BP网络对                             predicted value of wear data under SQPSO-DELM
                                                                图 8    SQPSO-DELM磨耗数据训练值和预测值的对比图
            磨耗量进行了预测,因此,本文中选择BP、PSO-BP作
            为对比算法,从而验证SQPSO-DELM与原有预测方法
                                                                  0.55
            相比,具有磨耗预测的优越性. 其中,隐含层神经元个                                       Target output
                                                                  0.50      Simulation output
            数均设置为20,LSSVM的激活函数采用高斯径向基                             0.45
            核函数,其他方法的激活函数均采用Sigmoid函数,优                           0.40

            化算法的粒子数设为30,迭代的次数为20.                                Maximum wear value  0.35
                为了进一步分析模型预测效果及准确度,这里采                             0.30

            取以下4个性能指标:平均绝对误差(mean absolute
                                                                  0.25
            error, MAE)、均方根误差(root mean square error, RMSE)、
                                                                  0.20
            最大绝对误差(maximum absolute error, MAXE)和平                   0     10    20     30    40    50    60
                                                                                   Testing sample
            均绝对百分误差(mean absolute percentage error, MAPE).
                                                               Fig. 9    Comparison diagram of wear data testing sample value
            RMSE和MAXE用于测量期望输出和实际输出之间的                                  and predicted value under SQPSO-DELM
            偏差,MAE和MAPE能较好地反映预测误差的实际情                           图 9    SQPSO-DELM磨耗数据测试值和预测值的对比图
   69   70   71   72   73   74   75   76   77   78   79