Page 82 - 《爆炸与冲击》2025年第9期
P. 82

第 45 卷             肖    敏,等: 含空穴炸药硝基甲烷冲击转爆轰过程的数值模拟                              第 9 期

                     10                          10                          10

                     8                           8                           8
                    y/mm  6 4                   y/mm  6 4                   y/mm  6 4

                     2                           2                           2

                     0   2  4  6  8 10 12 14 16  0   2  4  6  8 10 12 14 16  0   2  4  6  8 10 12 14 16
                                x/mm                        x/mm                        x/mm

                       λ 0.002 0.004 0.006 0.008 0.010  λ 0.006 0.009 0.012 0.015 0.018  λ 0.005 0.010 0.015 0.020 0.025
                             (a) 0.74 μs                 (b) 1.35 μs                 (c) 2.20 μs
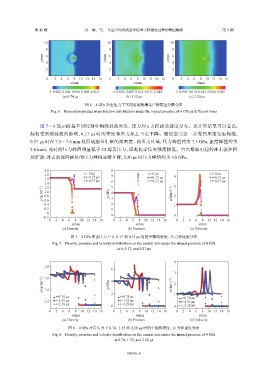
                                       图 6    4 GPa 冲击压力下不同时刻的爆轰产物质量分数分布
                        Fig. 6    Detonation product mass fraction distributions under the impact pressure of 4 GPa at different times


                   图  7~8  展示的是不同时刻中轴线处的密度、压力和                    x 方向运动速度分布。从计算结果可以看出:
               起初受到稀疏波的影响,0.17 μs 时的密度和压力从左至右下降。随后空穴进一步受到压缩发生塌缩,

               0.37 μs 时在  7.5~7.6 mm  处形成能量汇聚的高密度、高压力区域,压力峰值约为                       7.5 GPa,速度峰值约为
               3.6 km/s,此时的压力峰值明显低于           CJ 爆轰压力,因此化学反应强度较低。空穴塌陷引起的冲击波往四
               周扩散,冲击波波阵面处的压力峰值逐渐下降,2.20 μs 时压力峰值约为                          4.8 GPa。

                     2.0                          8

                     1.8               t=0 μs     7                t=0 μs     4                t=0 μs
                     1.6               t=0.17 μs                   t=0.17 μs                   t=0.17 μs
                                                                   t=0.37 μs
                                                                                               t=0.37 μs
                                       t=0.37 μs
                     1.4                          6 5                         3
                     1.2
                    ρ/(g·cm −3 )  1.0            p/GPa  4 3                  u/(km·s −1 )  2
                     0.8
                     0.6
                     0.4                          2                           1
                     0.2                          1
                      0
                    −0.2                          0                           0
                       0  2  4  6  8  10 12 14 16  0  2  4  6  8  10 12 14 16  0  2  4  6  8  10 12 14 16
                                 x/mm                        x/mm                        x/mm
                             (a) Density                  (b) Pressure               (c) Velocity
                                图 7    4 GPa 冲击压力下  0、0.17  和  0.37 μs 时的中轴线密度、压力和速度分布
                        Fig. 7    Density, pressure and velocity distributions on the central axis under the impact pressure of 4 GPa
                                                     at 0, 0.17, and 0.37 μs


                                                                              4

                     1.8
                                                  6
                                                                              3
                     1.6                          4
                    ρ/(g·cm −3 )  1.4            p/GPa                       u/(km·s −1 )  2

                          t=0.74 μs               2   t=0.74 μs               1   t=0.74 μs
                     1.2  t=1.35 μs                   t=1.35 μs                   t=1.35 μs
                          t=2.20 μs               0   t=2.20 μs               0   t=2.20 μs
                       0  2  4  6  8  10 12 14 16  0  2  4  6  8  10 12 14 16  0  2  4  6  8  10 12 14 16
                                 x/mm                        x/mm                        x/mm
                             (a) Density                  (b) Pressure               (c) Velocity
                               图 8    4 GPa 冲击压力下  0.74、1.35  和  2.20 μs 时的中轴线密度、压力和速度分布
                        Fig. 8    Density, pressure and velocity distributions on the central axis under the impact pressure of 4 GPa
                                                    at 0.74, 1.35, and 2.20 μs


                                                         092301-8
   77   78   79   80   81   82   83   84   85   86   87