
Page 87 - 《爆炸与冲击》2025年第9期
P. 87
第 45 卷 肖 敏,等: 含空穴炸药硝基甲烷冲击转爆轰过程的数值模拟 第 9 期
10 10 10 10
8 8 8 8
y/mm 6 4 y/mm 6 4 y/mm 6 4 y/mm 6 4
2 2 2 2
0 2 4 6 8 10 12 14 16 0 2 4 6 8 10 12 14 16 0 2 4 6 8 10 12 14 16 0 2 4 6 8 10 12 14 16
x/mm x/mm x/mm x/mm
λ 0.1 0.2 0.3 0.4 0.5 0.6 0.7 λ 0.2 0.4 0.6 0.8 λ 0.2 0.4 0.6 0.8 1.0 λ 0.2 0.4 0.6 0.8 1.0
(a) 0.58 μs (b) 0.78 μs (c) 0.90 μs (d) 1.50 μs
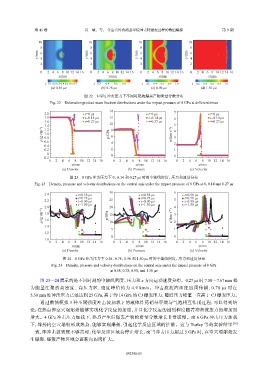
图 22 8 GPa 冲击压力下不同时刻的爆轰产物质量分数分布
Fig. 22 Detonation product mass fraction distributions under the impact pressure of 8 GPa at different times
14
2.0 t=0 μs t=0 μs 7 t=0 μs
1.8 t=0.14 μs 12 t=0.14 μs 6 t=0.14 μs
1.6 t=0.27 μs 10 t=0.27 μs t=0.27 μs
1.4 8 5
ρ/(g·cm −3 ) 1.0 p/GPa 6 u/(km·s −1 ) 4 3
1.2
0.8
0.6
0.4 4 2
0.2 2 1
0 0
−0.2 0
0 2 4 6 8 10 12 14 16 0 2 4 6 8 10 12 14 16 0 2 4 6 8 10 12 14 16
x/mm x/mm x/mm
(a) Density (b) Pressure (c) Velocity
图 23 8 GPa 冲击压力下 0、0.14 和 0.27 μs 时的中轴线密度、压力和速度分布
Fig. 23 Density, pressure and velocity distributions on the central axis under the impact pressure of 8 GPa at 0, 0.14 and 0.27 μs
30 6
2.4 t=0.58 μs t=0.58 μs t=0.58 μs
2.2 t=0.78 μs 25 t=0.78 μs 5 t=0.78 μs
t=0.90 μs
t=0.90 μs
t=0.90 μs
2.0 t=1.50 μs 20 t=1.50 μs 4 t=1.50 μs
ρ/(g·cm −3 ) 1.8 p/GPa 15 u/(km·s −1 ) 3
1.6
1.4 10 2
5 1
1.2
0 0
1.0
0 2 4 6 8 10 12 14 16 0 2 4 6 8 10 12 14 16 0 2 4 6 8 10 12 14 16
x/mm x/mm x/mm
(a) Density (b) Pressure (c) Velocity
图 24 8 GPa 冲击压力下 0.58、0.78、0.90 和 1.50 μs 时的中轴线密度、压力和速度分布
Fig. 24 Density, pressure and velocity distributions on the central axis under the impact pressure of 8 GPa
at 0.58, 0.78, 0.90, and 1.50 μs
图 23~24 展示的是不同时刻的中轴线密度、压力和 x 方向运动速度分布。0.27 μs 时 7.50~7.67 mm 处
为能量汇聚的高密度、高压力区,速度峰值约为 4.9 km/s。冲击波波阵面往四周传播,0.78 μs 时在
5.50 mm 处冲击压力已经达到 25 GPa,高于约 14 GPa 的 CJ 爆轰压力,随后压力峰值一直高于 CJ 爆轰压力。
通过数值模拟 3 种不同强度冲击波加载下的液体炸药硝基甲烷与气泡相互作用过程,可以得到结
论:在热点即空穴塌缩处能够实现化学反应的加速,并且化学反应的剧烈程度随着冲击波压力的增加而
增大。4 GPa 冲击压力加载下,热点产生后爆轰产物的质量分数增长非常缓慢。而 6 GPa 冲击压力加载
下,炸药内空穴塌缩形成热点,能够实现爆轰,引起化学反应区域的扩散。这与 Turley 等的实验结果 [36]
一致,即冲击波强度不够高时,化学反应区域会停止增长,而当冲击压力超过 5 GPa 时,在空穴塌缩处发
生爆轰,爆轰产物区域会逐渐向四周扩大。
092301-13