
Page 30 - 《爆炸与冲击》2025年第5期
P. 30
第 45 卷 柏劲松,等: 端到端机器学习代理模型构建及其在爆轰驱动问题中的应用 第 5 期
材料的空间分布,并与数值模拟结果进行对比。表 4 给出了流场中材料动态时空分布代理模型计算的
流场体积分数与数值模拟结果的标准差以及相对误差(体积分数为 0~1 之间的无量纲数),可以看出,
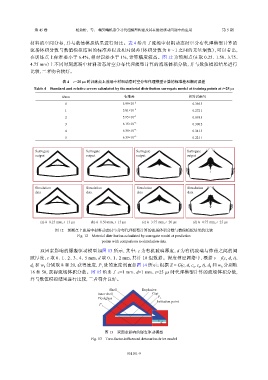
在训练点上标准差小于 6.4%,相对误差小于 1%,计算精度较高。图 12 为预测点(h 取 0.25、1.50、3.75、
4.75 mm)上不同时刻流场中材料动态时空分布代理模型计算的流场体积分数,并与数值模拟结果进行
比较,二者吻合较好。
t =25 µs 时训练点上流场中材料动态时空分布代理模型计算的标准差和相对误差
表 4
Table 4 Standard and relative errors calculated by the material distribution surrogate model at training points at t=25 μs
h/mm 标准差 相对误差/%
0 5.99×10 −2 0.395 3
1 5.81×10 −2 0.272 1
2 5.95×10 −2 0.095 5
3 6.15×10 −2 0.308 2
4 6.30×10 −2 0.341 5
5 6.39×10 −2 0.221 1
Surrogate Surrogate Surrogate Surrogate
output output output output
Simulation Simulation Simulation Simulation
data data data data
(a) h=0.25 mm, t=13 µs (b) h=1.50 mm, t=15 µs (c) h=3.75 mm, t=20 µs (d) h=4.75 mm, t=25 µs
图 12 预测点上流场中材料动态时空分布代理模型计算的流场体积分数与数值模拟结果的比较
Fig. 12 Material distribution calculated by surrogate model at prediction
points with comparison to simulation data
双因素影响的爆轰驱动模型如图 13 所示,其中:c 为有机玻璃厚度,d 为有机玻璃与炸药之间的间
隙厚度,c 取 0、1、2、3、4、5 mm,d 取 0、1、2 mm,共计 18 组数据。深度神经网络中,根据 v = f(c, d, t),
d 和 h w 分别取 8 和 20,获得速度,P 处的速度剖面如图 14 所示;根据 Z = G(c, d, c , c , t),d 和 h w 分别取
1
h
h
x y
16 和 50,获得流场体积分数。图 15 给出了 c=1 mm、d=1 mm、t=25 µs 时代理模型计算的流场体积分数,
并与数值模拟结果进行比较,二者符合良好。
Shell Explosive
Inner shell Gap
Plexiglass P 2
Initiation point
P 1
c d
图 13 双因素影响的爆轰驱动模型
Fig. 13 Two-factor-influenced detonation drive model
051101-9