
Page 78 - 《中国药科大学学报》2026年第1期
P. 78
72 学报 Journal of China Pharmaceutical University 2026, 57(1): 68 − 77 第 57 卷
A375 和 B16 细胞克隆数明显减少(图 1-B),表明其 生了凋亡。利用流式细胞仪进一步检测不同浓度
可显著抑制黑色素瘤细胞生长。 五氟利多对 A375 和 B16 细胞凋亡的影响。与对
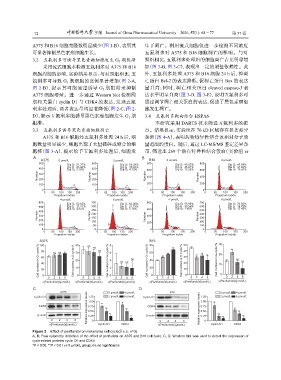
3.2 五氟利多可诱导黑色素瘤细胞发生 G 期阻滞 照组相比,五氟利多处理组的细胞凋亡占比明显增
1
采用流式细胞术检测五氟利多对 A375 和 B16 加(图 3-B,图 3-C),表现出一定的剂量依赖性。此
细胞周期的影响,实验结果显示:与对照组相比,五 外,五氟利多处理 A375 和 B16 细胞 24 h 后,抑凋
氟利多可导致 G 期细胞的比例显著增加(图 2-A, 亡蛋白 Bcl-2 的表达降低,促凋亡蛋白 Bax 的表达
1
图 2-B),提示其可能通过诱导 G 期阻滞来抑制 量升高;同时,凋亡相关蛋白 cleaved caspase-3 表
1
A375 细胞增殖。进一步通过 Western blot 检测周 达水平明显升高(图 3-D,图 3-E),说明五氟利多可
期相关蛋白 cyclin D1 与 CDK4 的表达,发现五氟 通过调节凋亡相关蛋白的表达,促进了黑色素瘤细
利多处理后,两者表达量均显著降低(图 2-C,图 2- 胞发生凋亡。
D),提示五氟利多能诱导黑色素瘤细胞发生 G 期 3.4 五氟利多靶向结合 HSPA6
1
阻滞。 本研究采用 DARTS 技术筛选五氟利多的靶
3.3 五氟利多诱导黑色素瘤细胞凋亡 点。结果显示,实验组在 70 kD 区域存在显著差异
A375 和 B16 细胞经五氟利多处理 24 h 后,细 条带(图 4-A),表明药物特异性结合该相对分子质
胞数量明显减少,细胞出现了大量破碎或缩合的细 量范围的蛋白。随后,通过 LC-MS/MS 鉴定差异条
胞核(图 3-A),提示给予五氟利多处理后,细胞发 带,筛选出 269 个潜在特异性结合蛋白(实验组 vs
A A375 B B16
500 0 μmol/L 500 2 μmol/L 800 0 μmol/L Dip G1 40.82% 800 2 μmol/L
Dip G1 56.29%
Dip G1 48.84%
Dip G1 51.37%
400 Dip S 45.45% 400 Dip S 39.60% Dip S 45.91% 600 Dip S 31.66%
Dip G2 13.26%
Dip G2 3.18%
Dip G2 4.10%
Dip G2 19.50%
Number 300 Number 300 Number 600 Number 400
400
200
200
100 100 200 200
0 0 0 0
0 50 100 150 200 0 50 100 150 200 0 50 100 150 200 0 50 100 150 200
Propidium lodide Propidium lodide Propidium lodide Propidium lodide
4 μmol/L 6 μmol/L 4 μmol/L 6 μmol/L
600 Dip G1 62.83% 350 Dip G1 63.05% 800 Dip G1 55.99% 700 Dip G1 70.80%
500 Dip S 33.41% 300 Dip S 31.79% 600 Dip S 30.54% 600 Dip S 16.78%
Dip G2 5.16%
Dip G2 12.42%
Dip G2 1.46%
Dip G2 4.82%
Number 400 Number 250 Number 400 Number 500
400
200
300
150
300
200
100 100 200 200
50
100
0 0 0 0
0 50 100 150 200 0 50 100 150 200 0 50 100 150 200 0 50 100 150 200
Propidium lodide Propidium lodide Propidium lodide Propidium lodide
A375 40 ns ns ns 8 B16 ** 50 30 **
100
80
Cell numbers in G1 cycle % 80 ns ns * Cell numbers in S cycle % 30 Cell numbers in G2 cycle % 6 4 2 ns ns ns Cell numbers in G1 cycle % 60 ** ** Cell numbers in S Cycle % 40 ** ** ** Cell numbers in G2 cycle % 20 ns ns
30
60
40
20
20
40
10
20
10
20
10
0
0
0
0
0
0
4
6
2
0
2
0
6
4
4
6
0
2
2
4
6
6
0
4
2
0
6
4
0
2
c(Penfluridol)/(μmol/L) c(Penfluridol)/(μmol/L) c(Penfluridol)/(μmol/L) c(Penfluridol)/(μmol/L) c(Penfluridol)/(μmol/L) c(Penfluridol)/(μmol/L)
C D
A375 0 μmol/L 4 μmol/L B16 0 μmol/L 4 μmol/L
Cyclin D1 1.25 2 μmol/L 6 μmol/L Cyclin D1 1.25 2 μmol/L 6 μmol/L
1.00
1.00
CDK4 Relative expression levels 0.75 ** ** * ** CDK4 Relative expression levels 0.75 ** *
β-actin 0.50 ** ** β-actin 0.50 ** ** ** **
0.25
0.25
0 2 4 6 0 0 2 4 6 0
c(Penfluridol)/(μmol/L) Cyclin D1 CDK4 c(Penfluridol)/(μmol/L) Cyclin D1 CDK4
Figure 2 Effect of penfluridol on melanoma cell cycle( x ± s, n=3)
A, B: Flow cytometry detection of the effect of penfluridol on A375 and B16 cell cycle; C, D: Western blot was used to detect the expression of
cycle-related proteins cyclin D1 and CDK4
*P < 0.05, **P < 0.01 vs 0 µmol/L group; ns:no significance