
Page 79 - 《运动与健康科学》(英文)2024年第2期
P. 79
TaggedFigure TaggedEndSitting and physical activity with adult body fat 201
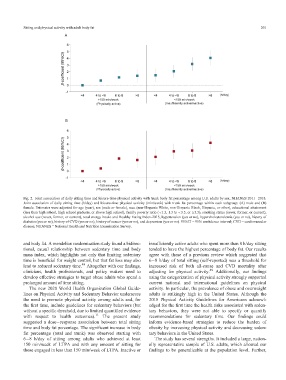
Fig. 2. Joint association of daily sitting time and leisure-time physical activity with trunk body fat percentage among U.S. adults by sex, NHANES 20112018.
Joint association of daily sitting time (h/day) and leisure-time physical activity (min/week) with trunk fat percentage within each subgroup: (A) male and (B)
female. Estimates were adjusted for age (year), sex (male or female), race (non-Hispanic White, non-Hispanic Black, Hispanic, or other), educational attainment
(less than high school, high school graduate, or above high school), family poverty ratio (<1.3, 1.3 to <3.5, or 3.5), smoking status (never, former, or current),
alcohol use (never, former, or current), total energy intake and Healthy Eating Index-2015, hypertension (yes or no), hypercholesterolemia (yes or no), history of
diabetes (yes or no), history of CVD (yes or no), history of cancer (yes or no), and depression (yes or no). 95%CI = 95% confidence interval; CVD = cardiovascular
disease; NHANES = National Health and Nutrition Examination Survey.TaggedEnd
and body fat. A mendelian randomization study found a bidirec- insufficiently active adults who spent more than 8 h/day sitting
tional, causal relationship between sedentary time and body tended to have the highest percentage of body fat. Our results
mass index, which highlights not only that limiting sedentary agree with those of a previous review which suggested that
time is beneficial for weight control, but that fat loss may also 68 h/day of total sitting (self-reported) was a threshold for
lead to reduced sedentary time. 48 Altogether with our findings, increased risk of both all-cause and CVD mortality after
clinicians, health professionals, and policy makers need to adjusting for physical activity. 49 Additionally, our findings
develop effective strategies to target obese adults who spend a using the categorization of physical activity strongly supported
current national and international guidelines on physical
prolonged amount of time sitting.TaggedEnd
TaggedPThe new 2020 World Health Organization Global Guide- activity. In particular, the prevalence of obese and overweight
lines on Physical Activity and Sedentary Behavior underscore adults is strikingly high in the United States. Although the
the need to promote physical activity among adults and, for 2018 Physical Activity Guidelines for Americans acknowl-
the first time, include guidelines for sedentary behaviors (but edged for the first time the health risks associated with seden-
without a specific threshold, due to limited quantified evidence tary behaviors, they were not able to specify or quantify
with respect to health outcomes). 11 The present study recommendations for sedentary time. Our findings could
suggested a doseresponse association between total sitting inform evidence-based strategies to reduce the burden of
time and body fat percentage. The significant increase in body obesity by increasing physical activity and decreasing seden-
fat percentage (total and trunk) was observed starting with tary behaviors in the United States.TaggedEnd
68 h/day of sitting among adults who achieved at least TaggedPThe study has several strengths. It included a large, nation-
150 min/week of LTPA and with any amount of sitting for ally representative sample of U.S. adults, which allowed our
those engaged in less than 150 min/week of LTPA. Inactive or findings to be generalizable at the population level. Further,