
Page 77 - 《运动与健康科学》(英文)2024年第2期
P. 77
TaggedEndSitting and physical activity with adult body fat 199
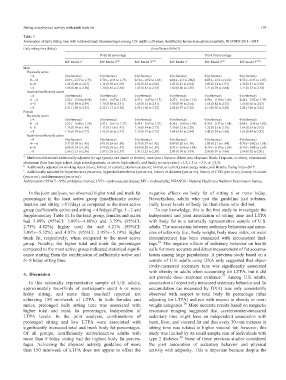
TaggedEndTable 3
Association of daily sitting time with total and trunk fat percentages among U.S. adults 20 years, stratified by leisure-time physical activity, NHANES 20112018.
Daily sitting time (h/day) b-coefficient (95%CI)
Total fat percentage Trunk fat percentage
MV Model 1 a MV Model 2 a,b MV Model 3 a,b,c MV Model 1 a MV Model 2 a,b MV model 3 a,b,c
Male
Physically active
<4 0 (reference) 0 (reference) 0 (reference) 0 (reference) 0 (reference) 0 (reference)
4<6 0.69 (0.37 to 1.75) 0.70 (0.34 to 1.75) 0.56 (0.52 to 1.64) 0.86 (0.3 to 2.02) 0.85 (0.31 to 2.01) 0.72 (0.43 to 1.87)
68 1.24 (0.40 to 2.07) 1.14 (0.30 to 1.98) 1.15 (0.25 to 2.06) 1.13 (0.21 to 2.04) 1.05 (0.14 to 1.97) 1.30 (0.31 to 2.30)
>8 1.68 (0.86 to 2.50) 1.70 (0.87 to 2.54) 1.47 (0.55 to 2.38) 1.60 (0.68 to 2.51) 1.71 (0.78 to 2.64) 1.71 (0.73 to 2.70)
Inactive/insufficiently active
<4 0 (reference) 0 (reference) 0 (reference) 0 (reference) 0 (reference) 0 (reference)
4<6 0.22 (0.54 to 0.98) 0.48 (0.27 to 1.23) 0.35 (0.47 to 1.17) 0.27 (0.62 to 1.16) 0.58 (0.30 to 1.46) 0.44 (0.52 to 1.39)
68 1.79 (0.98 to 2.59) 1.70 (0.88 to 2.51) 1.46 (0.61 to 2.31) 1.80 (0.96 to 2.64) 1.68 (0.82 to 2.53) 1.56 (0.66 to 2.47)
>8 2.31 (1.28 to 3.35) 2.22 (1.17 to 3.28) 2.13 (1.04 to 3.23) 2.14 (0.97 to 3.32) 2.10 (0.92 to 3.28) 2.24 (1.04 to 3.43)
Female
Physically active
<4 0 (reference) 0 (reference) 0 (reference) 0 (reference) 0 (reference) 0 (reference)
4<6 0.32 (0.64 to 1.28) 0.33 (0.61 to 1.27) 0.34 (0.63 to 1.31) 0.36 (0.80 to 1.51) 0.39 (0.77 to 1.54) 0.64 (0.54 to 1.82)
68 1.18 (0.39 to 1.98) 1.11 (0.31 to 1.91) 1.36 (0.54 to 2.17) 1.30 (0.32 to 2.28) 1.22 (0.25 to 2.18) 1.65 (0.65 to 2.65)
>8 1.76 (0.79 to 2.73) 1.62 (0.66 to 2.57) 1.75 (0.75 to 2.75) 1.64 (0.45 to 2.84) 1.42 (0.24 to 2.60) 1.65 (0.44 to 2.87)
Inactive/insufficiently active
<4 0 (reference) 0 (reference) 0 (reference) 0 (reference) 0 (reference) 0 (reference)
4<6 0.77 (0.09 to 1.45) 0.91 (0.24 to 1.58) 0.75 (0.07 to 1.42) 0.89 (0.02 to 1.76) 1.03 (0.21 to 1.84) 0.78 (0.02 to 1.58)
68 0.86 (0.14 to 1.58) 0.79 (0.10 to 1.47) 0.89 (0.20 to 1.59) 0.91 (0.06 to 1.88) 0.79 (0.10 to 1.69) 0.79 (0.08 to 1.65)
>8 1.86 (1.15 to 2.56) 1.87 (1.18 to 2.57) 1.91 (1.25 to 2.58) 2.03 (0.98 to 3.09) 2.03 (0.99 to 3.06) 1.86 (0.92 to 2.81)
a
Multivariable model additionally adjusted for age (years), sex (male or female), race (non-Hispanic White, non-Hispanic Black, Hispanic, or other), educational
attainment (less than high school, high school graduate, or above high school), and family poverty ratio (<1.3, 1.3 to <3.5, or 3.5).
b
Additionally adjusted for smoking status (never, former, or current), alcohol use (never, former, or current), total energy intake, and Healthy Eating Index-2015.
c
Additionally adjusted for hypertension (yes or no), hypercholesterolemia (yes or no), history of diabetes (yes or no), history of CVD (yes or no), history of cancer
(yes or no), and depression (yes or no).
Abbreviations: 95%CI = 95% confidence interval; CVD = cardiovascular disease; MV = multivariable; NHANES = National Health and Nutrition Examination Survey.
TaggedPIn the joint analyses, we observed higher total and trunk fat negative effects on body fat of sitting 6 or more h/day.
percentages in the least active group (insufficiently active/ Nevertheless, adults who met the guideline had substan-
inactive and sitting >8 h/day) as compared to the most active tially lower levels of body fat than those who did not.TaggedEnd
group (sufficiently active and sitting <4 h/day) (Figs. 12 and TaggedPTo our knowledge, this is the first study to investigate the
Supplementary Table 1). In the least group, females and males independent and joint association of sitting time and LTPA
had 3.99% (95%CI: 3.09%4.88%) and 3.79% (95%CI: with body fat in a nationally representative sample of U.S.
2.75%4.82%) higher total fat and 4.21% (95%CI: adults. The association between sedentary behaviors and meas-
3.09%5.32%) and 4.07% (95%CI: 2.95%5.19%) higher ures of adiposity (i.e., body weight, body mass index, or waist
trunk fat, respectively, when compared to the most active circumference) has been examined with inconsistent find-
group. Notably, the higher total and trunk fat percentages ings. 21 The negative effects of sedentary behavior on health
compared to the most active group indicated statistical signifi- calls for more accurate and direct measurement of fat accumu-
cance starting from the combination of sufficiently active and lation among large populations. A previous study based on a
sample of U.S. adults using DXA only suggested that objec-
68 h/day sitting time.TaggedEnd
tively-measured sedentary time was significantly associated
with obesity in adults when accounting for LTPA, but it did
TaggedH14. DiscussionTaggedEnd 37
not provide doseresponse evidence. Among U.S. adults,
TaggedPIn this nationally representative sample of U.S. adults, association of objectively measured sedentary behavior and fat
approximately two-thirds of participants spent 6 or more accumulation (as measured by DXA) was only consistently
h/daysitting, andmorethanone-halfreportednot observed with respect to total body fat percentage (after
achieving 150 min/week of LTPA. In both females and adjusting for LTPA) and not with respect to obesity or over-
males, prolonged daily sitting time was associated with weight categories. 20 More accurate results based on magnetic
higher total and trunk fat percentages, independent of resonance imaging suggested that accelerometer-measured
LTPA levels. In the joint analysis, combinations of sedentary time might have an independent association with
prolonged sitting and low LTPA were associated with heart, liver, and visceral fat and that every 30-min increase in
significantly increased total and trunk body fat percentages. sitting time was related to higher visceral fat; however, this
Of all groups, insufficiently active/inactive adults with study was limited by its small sample size of individuals with
more than 8 h/day sitting had the highest body fat percen- type 2 diabetes. 38 None of these previous studies considered
tages. Achieving the physical activity guideline of more the joint association of sedentary behavior and physical
than 150 min/week of LTPA does not appear to offset the activity with adiposity. This is important because despite the