
Page 76 - 《运动与健康科学》(英文)2024年第2期
P. 76
TaggedEnd198 J. Liao et al.
adjusting for sociodemographic and lifestyle factors and conditions. Among females, those engaged in insufficient
chronic conditions (Table 2). Specifically, females and males LTPA also had lower total fat (0.63%, 95%CI: 1.10% to
who spent more than 8 h/day sitting had 1.97% (95%CI: 0.15%) and trunk fat (0.67%, 95%CI: 1.31% to 0.04%)
1.39%2.55%) and 1.84% (95%CI: 1.06%2.62%) higher than those who were inactive, but this association was attenu-
total fat, respectively, compared with those who spent less ated to null after additionally adjusting for lifestyle behaviors
than 4 h/day sitting. Meanwhile, females and males who spent and chronic conditions (total fat: 0.47%, 95%CI: 0.97% to
more than 8 h/day sitting had 1.91% (95%CI: 1.11%2.70%) 0.03%; trunk fat: 0.55%, 95%CI: 1.22% to 0.13%). Similar
and 2.03% (95%CI: 1.16%2.90%) higher trunk fat, respec- findings were observed in males who engaged in insufficient
tively. A significant doseresponse relationship was exhibited LTPA.TaggedEnd
between daily sitting time and body fat percentage, such that
each 1 h/day increase in daily sitting time was associated with
0.23% (95%CI: 0.17%0.29%) and 0.20% (95%CI: TaggedH23.3. Daily sitting time and LTPA with body fatTaggedEnd
0.13%0.27%) higher total body fat among females and
TaggedPIn the analysis stratified by LTPA, prolonged daily sitting
males, respectively, while these increases were 0.23%
time was associated with higher total and trunk fat among
(95%CI: 0.14%0.31%) and 0.22% (95%CI: 0.14%0.30%)
adults who were physically active and inactive/insufficiently
for trunk fat.TaggedEnd
active (Table 3). Compared to sitting less than 4 h/day, sitting
more than 8 h/day was associated with 1.75% (95%CI:
TaggedH23.2. LTPA and body fatTaggedEnd
0.75%2.75%) and 1.47% (95%CI: 0.55%2.38%) higher
TaggedPBeing physically active was associated with lower total and total fat and 1.65% (95%CI: 0.44%2.87%) and 1.71%
trunk fat percentages (Table 2). Adults engaging in sufficient (95%CI: 0.73%2.70%) higher trunk fat among physically
LTPA tended to have lower total (female: 2.15%, 95%CI: active females and males, respectively. For those who were
2.69% to 1.61%; male: 1.98%, 95%CI: 2.52% to inactive/insufficiently active, sitting more than 8 h/day was
1.45%) and trunk (female: 2.26%, 95%CI: 2.96% to associated with 1.91% (95%CI: 1.25%2.58%) and 2.13%
1.57%; male: 2.12%, 95%CI: 2.71% to 1.52%) fat (95%CI: 1.04% 3.23%) higher total fat and 1.86% (95%CI:
compared with those who were inactive after adjusting for 0.92%2.81%) and 2.24% (95%CI: 1.04% to 3.43%) higher
sociodemographic factors, lifestyle behaviors, and health trunk fat among females and males, respectively.TaggedEnd
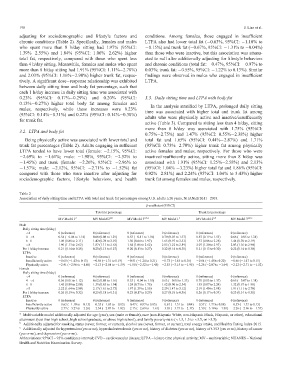
TaggedEndTable 2
Association of daily sitting time and LTPA with total and trunk fat percentages among U.S. adults 20 years, NHANES 20112018.
b-coefficient (95%CI)
Total fat percentage Trunk fat percentage
MV Model 1 a MV Model 2 a,b MV Model 3 a,b,c MV Model 1 a MV Model 2 a,b MV Model 3 a,b,c
Male
Daily sitting time (h/day)
<4 0 (reference) 0 (reference) 0 (reference) 0 (reference) 0 (reference) 0 (reference)
4<6 0.54 (0.06 to 1.14) 0.68 (0.08 to 1.29) 0.53 (0.11 to 1.18) 0.70 (0.03 to 1.37) 0.87 (0.19 to 1.55) 0.66 (0.05 to 1.38)
68 1.49 (0.88 to 2.11) 1.42 (0.78 to 2.07) 1.30 (0.64 to 1.97) 1.65 (0.97 to 2.33) 1.57 (0.86 to 2.28) 1.44 (0.70 to 2.19)
>8 1.90 (1.17 to 2.62) 1.87 (1.11 to 2.63) 1.84 (1.06 to 2.62) 2.05 (1.22 to 2.89) 2.07 (1.20 to 2.93) 2.03 (1.16 to 2.90)
Per 1 h/day increase 0.21 (0.14 to 0.28) 0.20 (0.13 to 0.27) 0.20 (0.13 to 0.27) 0.22 (0.14 to 0.30) 0.21 (0.13 to 0.30) 0.22 (0.14 to 0.30)
LTPA
Inactive 0 (reference) 0 (reference) 0 (reference) 0 (reference) 0 (reference) 0 (reference)
Insufficiently active 0.65 (1.43 to 0.13) 0.56 (1.31 to 0.19) 0.51 (1.24 to 0.21) 0.73 (1.63 to 0.16) 0.64 (1.48 to 0.20) 0.66 (1.47 to 0.15)
Physically active 2.41 (2.96 to 1.86) 2.13 (2.68 to 1.59) 1.98 (2.52 to1.45) 2.55 (3.15 to 1.95) 2.26 (2.87 to 1.64) 2.12 (2.71 to 1.52)
Female
Daily sitting time (h/day)
<4 0 (reference) 0 (reference) 0 (reference) 0 (reference) 0 (reference) 0 (reference)
4<6 0.56 (0.01 to 1.12) 0.62 (0.08 to 1.16) 0.53 (0.04 to 1.10) 0.63 (0.06 to 1.33) 0.70 (0.03 to 1.37) 0.65 (0.07 to 1.38)
68 1.45 (0.89 to 2.00) 1.39 (0.85 to 1.94) 1.24 (0.73 to 1.75) 1.62 (0.90 to 2.34) 1.55 (0.87 to 2.24) 1.32 (0.67 to 1.98)
>8 2.22 (1.64 to 2.80) 2.17 (1.61 to 2.73) 1.97 (1.39 to 2.55) 2.29 (1.47 to 3.12) 2.19 (1.40 to 2.98) 1.91 (1.11 to 2.70)
Per 1 h/day increase 0.26 (0.19 to 0.32) 0.25 (0.18 to 0.31) 0.23 (0.17 to 0.29) 0.27 (0.18 to 0.36) 0.26 (0.17 to 0.34) 0.23 (0.14 to 0.31)
LTPA
Inactive 0 (reference) 0 (reference) 0 (reference) 0 (reference) 0 (reference) 0 (reference)
Insufficiently active 0.63 (1.10 to 0.15) 0.55 (1.05 to 0.05) 0.47 (0.97 to 0.03) 0.67 (1.31 to 0.04) 0.57 (1.22 to 0.08) 0.55 (1.22 to 0.13)
Physically active 2.77 (3.27 to 2.26) 2.34 (2.87 to 1.82) 2.15 (2.69 to 1.61) 3.05 (3.73 to 2.37) 2.50 (3.19 to 1.80) 2.26 (2.96 to 1.57)
a
Multivariable model additionally adjusted for age (year), sex (male or female), race (non-Hispanic White, non-Hispanic Black, Hispanic, or other), educational
attainment (less than high school, high school graduate, or above high school), and family poverty ratio (<1.3, 1.3 to <3.5, or 3.5).
b
Additionally adjusted for smoking status (never, former, or current), alcohol use (never, former, or current), total energy intake, and Healthy Eating Index-2015.
c
Additionally adjusted for hypertension (yes or no), hypercholesterolemia (yes or no), history of diabetes (yes or no), history of CVD (yes or no), history of cancer
(yes or no), and depression (yes or no).
Abbreviations: 95%CI = 95% confidence interval; CVD = cardiovascular disease; LTPA = leisure-time physical activity; MV = multivariable; NHANES = National
Health and Nutrition Examination Survey.