
Page 75 - 《运动与健康科学》(英文)2024年第2期
P. 75
TaggedEndSitting and physical activity with adult body fat 197
White, non-Hispanic Black, Hispanic, and other. Educational two-sided, and statistical significance was set at a
attainment was categorized as less than high school diploma p value of less than 0.05.TaggedEnd
(less than high school), high school graduate, and some college
graduate or more (more than high school). Family poverty
TaggedH13. ResultsTaggedEnd
ratio was defined as the ratio of family income to the federal
TaggedPA total of 10,808 adults (weighted population = 127,746,295;
poverty level and categorized as <1.3, 1.3<3.5, and 3.5.
age = 39.4 § 0.2 years, mean § SE; 5371 (49.7%) males) were
Total energy intake and HEI-2015 were derived from a 24-h
included, and participant characteristics were presented by sex
dietary interview. The HEI-2015 is a measure for assessing
in Table 1. Approximately 54.6% of adults spent 6 or more h/
dietary quality and aligns with the Dietary Guidelines for
Americans; 35 scores range from 0 to 100, with higher scores day sitting, while 40.6% reported no LTPA (inactive), 16.1%
reported less than 150 min/week LTPA (insufficiently active),
reflecting better diet quality.TaggedEnd
and 43.3% reported 150 min/week or more LTPA (active) in
TaggedPHypertension was determined by participants receiving a
diagnosis from a health professional or NHANES-measured the past week.TaggedEnd
blood pressure 130 mmHg or more systolic or 80 mmHg or
more diastolic. Hypercholesterolemia was determined by TaggedH23.1. Daily sitting time and body fatTaggedEnd
participants receiving a diagnosis from a health professional or TaggedPProlonged daily sitting time was associated with greater
NHANES-measured total cholesterol level of 240 mg/dL or total and trunk fat percentages in both females and males after
more (to convert to millimoles per liter, multiply by 0.0259).
History of chronic diseases (diabetes, CVD, and cancer) was
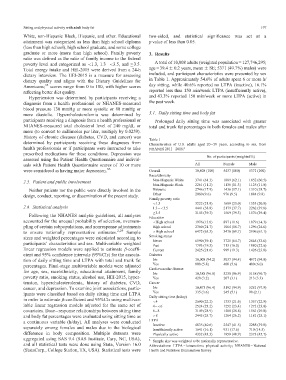
TaggedEndTable 1
determined by participants receiving these diagnoses from
Characteristics of U.S. adults aged 2059 years, according to sex, from
health professionals or if participants were instructed to take NHANES 20112018. a
prescribed medications for these conditions. Depression was
No. of participants (weighted%)
assessed using the Patient Health Questionnaire and individ-
uals with Patient Health Questionnaire scores of 10 or more All Female Male
36
were considered as having major depression. TaggedEnd Overall 10,808 (100) 5437 (100) 5371 (100)
Race/ethnicity
Non-Hispanic White 3741 (61.3) 1889 (62.1) 1852 (60.5)
TaggedH22.5. Patient and public involvementTaggedEnd
Non-Hispanic Black 2261 (11.2) 1136 (11.3) 1125 (11.0)
TaggedPNeither patients nor the public were directly involved in the Hispanic 2746 (17.9) 1436 (17.1) 1310 (18.7)
Other 2060 (9.6) 976 (9.5) 1084 (9.8)
design, conduct, reporting, or dissemination of the present study.TaggedEnd
Family poverty ratio
<1.3 3222 (21.9) 1689 (23.0) 1533 (20.8)
TaggedH22.6. Statistical analysisTaggedEnd 1.3<3.5 4441 (38.8) 2179 (37.7) 2262 (39.8)
3.5 3145 (39.3) 1569 (39.3) 1576 (39.4)
TaggedPFollowing the NHANES analytic guidelines, all analyses
Education
accounted for the unequal probability of selection, oversam- <High school 1976 (13.0) 897 (11.6) 1079 (14.3)
pling of certain subpopulations, and nonresponse adjustments High school 2360 (21.7) 1064 (18.7) 1296 (24.6)
to ensure nationally representative estimates. 2,29 Sample >High school 6472 (65.3) 3476 (69.7) 2996 (61.1)
Smoking status
sizes and weighted percentages were calculated according to
Never 6590 (59.1) 3725 (64.7) 2865 (53.6)
participants’ characteristics and sex. Multivariable weighted
Past 1793 (19.3) 713 (16.0) 1080 (22.6)
linear regression models were applied to estimate b-coeffi- Current 2425 (21.6) 999 (19.3) 1426 (23.8)
cient and 95% confidence intervals (95%CIs) for the associa- Diabetes
tion of daily sitting time and LTPA with total and trunk fat No 10,008 (94.2) 5037 (94.4) 4971 (94.0)
percentages. Final-stage multivariable models were adjusted Yes 800 (5.8) 400 (5.6) 400 (6.0)
Cardiovascular disease
for age, sex, race/ethnicity, educational attainment, family
No 10,388 (96.8) 5230 (96.9) 5158 (96.7)
poverty ratio, smoking status, alcohol use, HEI-2015, hyper- Yes 420 (3.2) 207 (3.1) 213 (3.3)
tension, hypercholesterolemia, history of diabetes, CVD, Cancer
cancer, and depression. To examine joint associations, partic- No 10,473 (96.4) 5192 (94.9) 5281 (97.9)
ipants were classified based on daily sitting time and LTPA Yes 335 (3.6) 245 (5.1) 90 (2.1)
Daily sitting time (h/day)
in order to estimate b-coefficient and 95%CIs using multivar-
<4 2690 (22.2) 1333 (21.6) 1357 (22.9)
iable linear regression models adjusted for the same set of 4<6 2524 (23.2) 1252 (23.4) 1272 (23.0)
covariates. Doseresponse relationships between sitting time 68 3149 (28.9) 1588 (28.8) 1561 (29.0)
and body fat percentages were evaluated using sitting time as >8 2445 (25.7) 1264 (26.2) 1181 (25.1)
LTPA
a continuous variable (h/day). All analyses were conducted
Inactive 4835 (40.6) 2547 (41.5) 2288 (39.8)
separately among females and males due to the biological
Insufficiently active 1641 (16.1) 931 (17.6) 710 (14.5)
difference in body composition. Multiple datasets were Physically active 4332 (43.3) 1959 (40.9) 2373 (45.7)
aggregated using SAS 9.4 (SAS Institute, Cary, NC, USA), a
Sample size was weighted to be nationally representative.
and all statistical tests were done using Stata, Version 16.0 Abbreviations: LTPA = leisure-time physical activity; NHANES = National
(StataCorp., College Station, TX, USA). Statistical tests were Health and Nutrition Examination Survey.