
Page 117 - 《运动与健康科学》(英文)2024年第2期
P. 117
TaggedAPTARAFigure TaggedAPTARAEndHeat exposure on brain activity and cognitive function 239
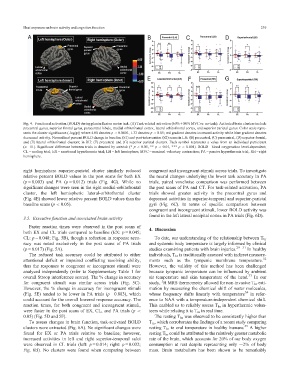
Fig. 4. Functional activation (BOLD) during plantarflexion motor task. (A) Task-related activation (60% + 80% MVC vs. no-task). Activated brain clusters include
precentral gyrus, superior frontal gyrus, paracentral lobule, medial orbitofrontal cortex, lateral orbitofrontal cortex, and superior parietal gyrus. Color scale repre-
sents the cluster significance (-log(p)) where 4.00 denotes p < 0.0001, 1.33 denotes p < 0.05; red gradient denotes increased activity while blue gradient denotes
decreased activity. Normalized percent BOLD change in baseline (S1) and post-intervention (S2) scans in LH: (B) precentral, (C) paracentral, (D) superior frontal,
and (E) lateral orbitofrontal clusters; in RH: (F) precentral and (G) superior parietal clusters. Each symbol represents a value from an individual participant
(n = 11). Significant difference between trials is denoted by asterisk (* p < 0.05, ** p < 0.01, *** p < 0.001). BOLD = blood oxygenation level-dependent;
CL = cooling trial; EX = exertional hyperthermia trial; LH = left hemisphere; MVC = maximal voluntary contraction; PA = passive hyperthermia trial; RH = right
hemisphere.TaggedAPTARAEnd
right hemisphere superior-parietal cluster similarly reduced congruent and incongruent stimuli across trials. To investigate
relative percent BOLD values in the post scans for both EX the neural changes underlying the lower task accuracy in PA
(p = 0.003) and PA (p = 0.012) trials (Fig. 4G). While no trials, paired voxelwise comparison was performed between
significant changes were seen in the right medial-orbitofrontal the post scans of PA and CT. For task-related activation, PA
cluster, the left hemispheric lateral-orbitofrontal cluster trials showed greater activity in the precentral gyrus and
(Fig. 4E) showed lower relative percent BOLD values than the depressed activities in superior-temporal and superior-parietal
gyri (Fig. 6C). In terms of specific comparison between
baseline scans (p < 0.05).TaggedAPTARAEnd
congruent and incongruent stimuli, lower BOLD activity was
found in the left lateral occipital cortex in PA trials (Fig. 6D).TaggedAPTARAEnd
TaggedAPTARAH23.5. Executive function and associated brain activityTaggedAPTARAEnd
TaggedAPTARAPFaster reaction times were observed in the post scans of
TaggedAPTARAH14. DiscussionTaggedAPTARAEnd
both EX and CL trials compared to baseline (EX: p = 0.045;
CL: p = 0.048; Fig. 5B), though a reduction in response accu- TaggedAPTARAPTo date, our understanding of the relationship between T br
racy was noted exclusively in the post scans of PA trials and systemic body temperature is largely informed by clinical
2931
studies examining patients with brain injuries. In healthy
(p = 0.017) (Fig. 5A).TaggedAPTARAEnd
TaggedAPTARAPThe reduced task accuracy could be attributed to either individuals, T br is traditionally assessed with indirect measure-
32
attentional deficit or impaired conflicting resolving ability, ments such as the tympanic membrane temperature.
thus the responses to congruent or incongruent stimuli were However, the validity of this method has been challenged
analyzed independently (refer to Supplementary Table 1 for because tympanic temperature can be influenced by ambient
overall Stroop interference scores). The % change in accuracy air temperature and skin temperature of the head. 33 In our
1
for congruent stimuli was similar across trials (Fig. 5C). study, H MRS thermometry allowed for non-invasive T br esti-
However, the % change in accuracy for incongruent stimuli mation by measuring the chemical shift of water molecules,
(Fig. 5E) tended to be lower in PA trials (p = 0.083), which whose frequency shifts linearly with temperature 34 in refer-
could account for the overall lowered response accuracy. The ence to NAA with a temperature-independent chemical shift.
reaction times, for both congruent and incongruent stimuli, This enabled us to reliably assess T br in hyperthermic volun-
were faster in the post scans of EX, CL, and PA trials (p < teers while relating it to T re in real time.TaggedAPTARAEnd
TaggedAPTARAPThe resting T br was observed to be consistently higher than
0.05) (Fig. 5D and 5F).TaggedAPTARAEnd
TaggedAPTARAPTo assess changes in brain function, task-activated BOLD T re , which corroborates the findings of a recent study comparing
clusters were extracted (Fig. 6A). No significant changes were resting T br to oral temperature in healthy humans. 35 Ahigher
found for EX or PA trials relative to baseline; however, resting T br could be attributed to the relatively greater metabolic
increased activities in left and right superior-temporal sulci rate of the brain, which accounts for 20% of our body oxygen
were observed in CL trials (left: p = 0.014; right: p = 0.032; consumption at rest despite representing only »2% of body
Fig. 6B). No clusters were found when comparing between mass. Brain metabolism has been shown to be remarkably