
Page 115 - 《运动与健康科学》(英文)2024年第2期
P. 115
TaggedAPTARAEndHeat exposure on brain activity and cognitive function 237
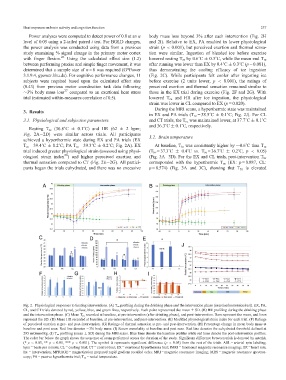
TaggedAPTARAPPower analyses were computed to detect power of 0.8 at an a body mass loss beyond 3% after each intervention (Fig. 2H
level of 0.05 using a 2-tailed paired t test. For BOLD changes, and 2I). Relative to EX, PA resulted in lower physiological
the power analysis was conducted using data from a previous strain (p < 0.001), but perceived exertion and thermal sensa-
study examining % signal change in the primary motor cortex tion were similar. Ingestion of blended ice before exercise
with finger flexion. 26 Using the calculated effect size (1.2) lowered resting T re by 0.6˚C § 0.3˚C, while the mean end T re
between performing precise and simple finger movement, it was after running was lower than EX by 0.4˚C § 0.3˚C (p = 0.001),
determined that a sample size of n = 8 was required (G*Power thus demonstrating the cooling efficacy of ice ingestion
3.1.9.4, gpower.hhu.de). For cognitive performance changes, 11 (Fig. 2C). While participants felt cooler after ingesting ice
subjects were required based upon the calculated effect size before exercise (2 units lower, p < 0.001), the ratings of
(0.43) from previous motor coordination task data following perceived exertion and thermal sensation remained similar to
»3% body mass loss 27 compared to an exertional heat stress those in the EX trial during exercise (Fig. 2F and 2G). With
lowered T re and HR after ice ingestion, the physiological
trial (estimated within-measures correlation of 0.5).TaggedAPTARAEnd
strain was lower in CL compared to EX (p = 0.020).TaggedAPTARAEnd
TaggedAPTARAPDuring the MRI scans, a hyperthermic state was maintained
TaggedAPTARAH13. ResultsTaggedAPTARAEnd
in EX and PA trials (T re = 38.5˚C § 0.1˚C; Fig. 2J). For CL
and CT trials, the T re was maintained lower, at 37.7˚C § 0.1˚C
TaggedAPTARAH23.1. Physiological and subjective parametersTaggedAPTARAEnd
and 36.3˚C § 0.1˚C, respectively.TaggedAPTARAEnd
TaggedAPTARAPResting T re (36.8˚C § 0.1˚C) and HR (62 § 2 bpm;
Fig. 2A2D) were similar across trials. All participants
TaggedAPTARAH23.2. Brain temperatureTaggedAPTARAEnd
achieved a hyperthermic state during EX and PA trials (EX
T re = 39.4˚C § 0.2˚C; PA T re = 39.3˚C § 0.2˚C; Fig. 2A). EX TaggedAPTARAPAt baseline, T br was consistently higher by »0.6˚C than T re
trial induced greater physiological strain (assessed using physi- (T br =37.3˚C § 0.4˚C vs. T re =36.7˚C § 0.2˚C, p < 0.05)
28
ological strain index ) and higher perceived exertion and (Fig. 3A3D). For the EX and CL trials, post-intervention T br
thermal sensation compared to CT (Fig. 2E2G). All partici- corresponded with the hyperthermic T re (EX: p =0.887, CL:
pants began the trials euhydrated, and there was no excessive p = 0.574) (Fig. 3A and 3C), showing that T br is elevated
TaggedAPTARAFigure
Fig. 2. Physiological responses to heating interventions. (A) T re profiling during the drinking phase and the intervention phase (exercise/immersion/rest). EX, PA,
CL, and CT trials denoted by red, yellow, blue, and green lines, respectively. Each point represented the mean § SD. (B) HR profiling during the drinking phase
and the intervention phase. (C) Mean T re recorded at baseline, at pre-intervention (after drinking phase), and post-intervention. Bars represent the mean, and lines
represent the SD. (D) Mean HR recorded at baseline, at pre-intervention, and post-intervention. (E) Modified physiological strain index for each trial. (F) Ratings
of perceived exertion at pre- and post-intervention. (G) Ratings of thermal sensation at pre- and post-intervention. (H) Percentage change in mean body mass at
baseline and post scan. Red line denotes 3% body mass. (I) Serum osmolality at baseline and post scan. Red line denotes the euhydrated threshold defined at
295 mOsmol/kg. (J) T re profiling (mean § SD) during the MRI scans. Blue lines denote the baseline profiles while red lines denote the post-intervention profiles.
The color bar below the graph shows the sequence of scans performed across the duration of the study. Significant difference between trials is denoted by asterisk
(* p < 0.05, ** p < 0.01, *** p < 0.001). The symbol D represents significant difference (p < 0.05) from the rest of the trials. ASL = arterial spin labeling;
bpm = beats per minute; CL = cooling trial; CT = control trial; EX = exertional hyperthermia trial; fMRI = functional magnetic resonance imaging; HR = heart rate;
Int = Intervention; MPRAGE = magnetization prepared rapid gradient recalled echo; MRI = magnetic resonance imaging; MRS = magnetic resonance spectros-
copy; PA = passive hyperthermia trial; T re = rectal temperature.TaggedAPTARAEnd