
Page 116 - 《运动与健康科学》(英文)2024年第2期
P. 116
TaggedAPTARAFigure TaggedAPTARAEnd238 X.R. Tan et al.
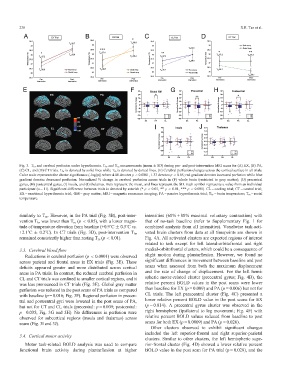
Fig. 3. T br and cerebral perfusion under hyperthermia. T br and T re measurements (mean § SD) during pre- and post-intervention MRI scans for (A) EX, (B) PA,
(C) CL, and (D) CT trials. T br is denoted by solid lines while T re is denoted by dotted lines. (E) Cerebral perfusion changes across the cortical surface in all trials.
Color scale represents the cluster significance (-log(p)) where 4.00 denotes p < 0.0001, 1.33 denotes p < 0.05; red gradient denotes increased perfusion while blue
gradient denotes decreased perfusion. Normalized % change in cerebral perfusion across trials in (F) whole brain (restricted to gray matter); (G) precentral
gyrus, (H) postcentral gyrus, (I) insula, and (J) thalamus. Bars represent the mean, and lines represent the SD. Each symbol represents a value from an individual
participant (n = 11). Significant difference between trials is denoted by asterisk (* p < 0.05, ** p < 0.01, *** p < 0.001). CL = cooling trial; CT = control trial;
EX = exertional hyperthermia trial; GM = gray matter; MRI = magnetic resonance imaging; PA = passive hyperthermia trial; T br = brain temperature; T re = rectal
temperature.TaggedAPTARAEnd
similarlytoT re . However, in the PA trial (Fig. 3B), post-inter- intensities (60% + 80% maximal voluntary contraction) with
vention T br was lower than T re (p < 0.05), with a lower magni- that of no-task baseline (refer to Supplementary Fig. 1 for
tude of temperature elevation from baseline (+0.9˚C § 0.5˚C vs. combined analysis from all intensities). Voxelwise task-acti-
vated brain clusters from data at all timepoints are shown in
+2.1˚C § 0.2˚C). In CT trials (Fig. 3D), post-intervention T br
Fig. 4A. All activated clusters are expected regions of interest
remained consistently higher than resting T re (p < 0.01).TaggedAPTARAEnd
related to task except for left lateral-orbitofrontal and right
medial-orbitofrontal clusters, which could be a consequence of
TaggedAPTARAH23.3. Cerebral blood flowTaggedAPTARAEnd
TaggedAPTARAPReductions in cerebral perfusion (p < 0.0001) were observed slight motion during plantarflexion. However, we found no
across parietal and frontal areas in EX trials (Fig. 3E). These significant differences in movement between baseline and post
scans when assessed from both the maximum displacement
deficits appeared greater and more distributed across cortical
and the rate of change of displacement. For the left hemi-
areas in PA trials. In contrast, the reduced cerebral perfusion in
spheric motor-related cluster (precentral gyrus; Fig. 4B), the
CL and CT trials was confined to smaller cortical regions, and it
relative percent BOLD values in the post scans were lower
was less pronounced in CT trials (Fig. 3E). Global gray matter
than baseline for EX (p = 0.009) and PA (p = 0.006) but not for
perfusion was reduced in the post scans of PA trials as compared
CL trials. The left paracentral cluster (Fig. 4C) presented a
with baseline (p = 0.016; Fig. 3F). Regional perfusion in precen-
lower relative percent BOLD value in the post scans for EX
tral and postcentral gyri were lowered in the post scans of PA,
(p = 0.014). A precentral gyrus cluster was observed in the
but not for CT and CL trials (precentral: p = 0.009; postcentral:
right hemisphere (ipsilateral to leg movement; Fig. 4F) with
p = 0.035; Fig. 3G and 3H). No differences in perfusion were
relative percent BOLD values reduced from baseline to post
observed for subcortical regions (insula and thalamus) across
scans for both EX (p = 0.0009) and PA (p = 0.026).TaggedAPTARAEnd
scans (Fig. 3I and 3J).TaggedAPTARAEnd
TaggedAPTARAPOther clusters observed to exhibit significant changes
included the left superior-frontal and right superior-parietal
TaggedAPTARAH23.4. Cortical motor activityTaggedAPTARAEnd
clusters. Similar to other clusters, the left hemispheric supe-
TaggedAPTARAPMotor task-related BOLD analysis was used to compare rior-frontal cluster (Fig. 4D) showed a lower relative percent
functional brain activity during plantarflexion at higher BOLD value in the post scan for PA trial (p = 0.020), and the