
Page 120 - 《水产学报》2025年第10期
P. 120
李森栋,等 水产学报, 2025, 49(10): 109609
2
1
0
−1
−2
CC_1 CC_2 CC_3 CP_1 CP_2 CP_3 NC_1 NC_2 NC_3 NP_1 NP_2 NP_3
(a)
neuropeptide signaling pathway
blood coagulation Calcium signaling pathway
regulation of body fluid levels
synaptic signaling count
trans-synaptic signaling Glycine,serine and threonine 5
regulation of transmembrane transport metabolism 10
behavior 15
response to wounding Vascular smooth muscle 20
inorganic ion homeostasis count contraction
GO Term chemical homeostasis 15 Folate biosynthesis pvalue
10
neuronal cell body
20
0.04
25
somatodendritic compartment
ion channel complex ONTOLOGY 0.03
BP Tryptophan metabolism 0.02
cation channel complex CC
receptor complex MF 0.01
peptide receptor activity Tyrosine metabolism
hormone activity
signaling receptor regulator activity
channel activity 2 3 4
monpatomic cation channel activity enrichment score (−log 10 (P-value))
2 4 6
−log 10 (P-adjust)
(b) (c)
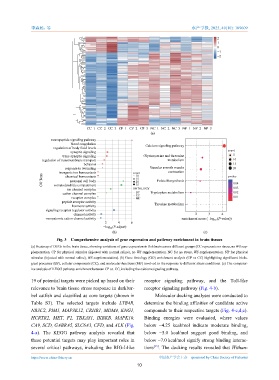
Fig. 3 Comprehensive analysis of gene expression and pathway enrichment in brain tissues
(a) Heatmap of DEGs in the brain tissue, showing variations of gene expression in fish brain across different groups (CC represents no stress, no WS sup-
plementation. CP for physical stimulus (injected with normal saline), no WS supplementation. NC for no stress, WS supplementation. NP for physical
stimulus (injected with normal saline), WS supplementation). (b) Gene Ontology (GO) enrichment analysis (CP vs CC) highlighting significant biolo-
gical processes (BP), cellular components (CC), and molecular functions (MF) involved in the response to different stress conditions. (c) The comparat-
ive analysis of KEGG pathway enrichment between CP vs. CC, including the calcium signaling pathway.
19 of potential targets were picked up based on their receptor signaling pathway, and the Toll-like
relevance to brain tissue stress response in darkbar- receptor signaling pathway (Fig. 4-b).
bel catfish and classified as core targets (shown in Molecular docking analyses were conducted to
Table S3). The selected targets include LTB4R, determine the binding affinities of candidate active
NR3C2, PIM1, MAP3K12, CRHR1, MDM4, KNG1, compounds to their respective targets (Fig. 4-c,d,e).
HCRTR2, MET, F2, TBXAS1, IKBKB, MAPK10, Binding energies were evaluated, where values
CA9, SCD, GABRA5, SLC6A3, CFD, and ALK (Fig. below −4.25 kcal/mol indicate moderate binding,
4-a). The KEGG pathway analysis revealed that below −5.0 kcal/mol suggest good binding, and
these potential targets may play important roles in below −7.0 kcal/mol signify strong binding interac-
[13]
several critical pathways, including the RIG-I-like tions . The docking results revealed that Withan-
https://www.china-fishery.cn 中国水产学会主办 sponsored by China Society of Fisheries
10