
Page 200 - 《软件学报》2021年第10期
P. 200
3172 Journal of Software 软件学报 Vol.32, No.10, October 2021
Table 15 Comparison of experimental results of eight algorithms on two test cases (Continued)
表 15 8 种算法在两个测试实例上的实验结果对比(续)
测试实例 维数 性能指标 MIFPA HCLPSO MPEDE FPA EOFPA MGOFPA
Mean 50.193 52.107 51.645 54.914 51.612 58.625
5 best 50.191 50.198 50.191 51.715 50.191 51.004
worst 50.236 61.136 61.092 62.073 77.094 62.388
Mean 50.870 55.247 52.904 54.012 55.960 59.074
10 best 48.103 48.433 48.093 49.014 48.126 50.016
worst 56.341 63.249 56.746 58.689 60.581 65.031
Mean 49.466 51.170 49.888 52.608 50.005 54.046
测试 15 best 47.877 48.047 47.862 49.652 47.847 51.646
实例 2
worst 50.437 54.608 50.822 54.317 50.835 56.382
Mean 48.634 53.305 48.879 52.520 48.863 54.661
20 best 47.869 48.946 47.827 50.869 47.902 52.286
worst 49.455 66.527 49.619 54.997 49.608 58.528
Mean 48.575 54.384 48.956 53.694 48.968 57.497
25 best 47.924 50.058 47.926 51.538 48.195 53.854
worst 49.109 62.888 50.171 57.937 50.242 61.758
100 100
90 90
80 80
70 70
y coordinate/km 60 y coordinate/km 60
50
50
40 40
30 30
20 20
10 10
0 10 20 30 40 50 60 70 0 10 20 30 40 50 60 70
x coordinate/km x coordinate/km
(a) D=20 (b) D=25
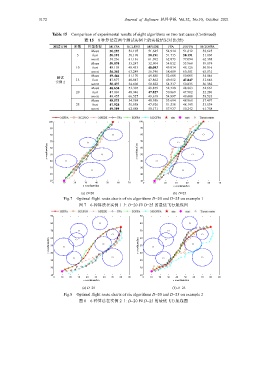
Fig.7 Optimal flight route charts of six algorithms D=20 and D=25 on example 1
图 7 6 种算法在实例 1 上 D=20 和 D=25 的最优飞行航线图
90 90
80 80
70 70
60
60
y coordinate/km 50 y coordinate/km 50
40
40
30 30
20 20
10 10
0 10 20 30 40 50 60 70 80 90 0 10 20 30 40 50 60 70 80 90
x coordinate/km x coordinate/km
(a) D=20 (b) D=25
Fig.8 Optimal flight route charts of six algorithms D=20 and D=25 on example 2
图 8 6 种算法在实例 2 上 D=20 和 D=25 的最优飞行航线图