Page 80 - 摩擦学学报2025年第4期
P. 80

568                                    摩擦学学报(中英文)                                        第 45 卷


                   (a)         0 kJ            (b)         5 kJ            (c)        10 kJ


                                        Area 2


                                                                                           Area 3
                            Area 1

                                                                            Area 4
                                     300 μm                      300 μm                       300 μm
                   (d)  Area 1   (e)           (f)  Area 2   (g)           (h)  Area 3    (i)


                          50 μm         50 μm          50 μm          50 μm         50 μm         50 μm
                   (j)         15 kJ           (k)         20 kJ           (l)         25 kJ

                      Area 5                                                                      Area 7


                                                                    Area 6
                                     300 μm                      300 μm                       300 μm

                   (m)  Area 4   (n)           (o)  Area 5   (p)           (q)   Area 6   (r)  Area 7


                           50 μm         50 μm          50 μm         50 μm         50 μm        50 μm


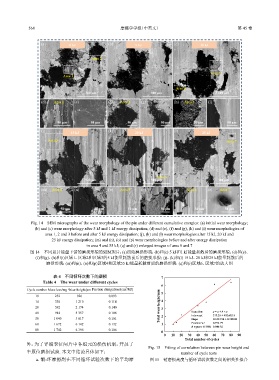
              Fig. 14    SEM micrographs of the wear morphology of the pin under different cumulative energies: (a) initial wear morphology;
                (b) and (c) wear morphology after 5 kJ and 1 kJ energy dissipation; (d) and (e), (f) and (g), (h) and (i) wear morphologies of
                    area 1, 2 and 3 before and after 5 kJ energy dissipation; (j), (k) and (l) wear morphologies after 15 kJ, 20 kJ and
                       25 kJ energy dissipation; (m) and (n), (o) and (p) wear morphologies before and after energy dissipation
                                      in area 4 and 55 kJ; (q) and (r) enlarged images of area 6 and 7
              图 14    不同累计能量下销的磨损形貌的SEM照片:(a)初始磨损形貌;(b)和(c) 5 kJ和1 kJ能量耗散后的磨损形貌;(d)和(e)、
                (f)和(g)、(h)和(i)区域1、区域2和区域3的5 kJ能量耗散前后的磨损形貌;(j)、(k)和(l) 15 kJ、20 kJ和25 kJ能量耗散后的
                     磨损形貌;(m)和(n)、(o)和(p)区域4和区域55 kJ能量耗散前后的磨损形貌;(q)和(r)区域6、区域7的放大图


                        表 4    不同循环次数下的磨损                             7
                   Table 4    The wear under different cycles
                                                                      6
                                                       3
             Cycle number Mass loss/mg Wear height/μm Friction dissipation/(cm /MJ)  5
                10      252       926          0.093
                14      330      1 210         0.114                  4
                20      592      2 174         0.140                 Total wear height/mm  3
                40      914      3 357         0.108                  2            Equation   y = a + b × x
                                                                                   Intercept
                                                                                            213.25 ± 402.652 5
                50      1 040    3 817         0.101                               Slope    82.223 54 ± 8.758 05
                60      1 672    6 142         0.132                  1            Pearson′s r   0.972 79
                                                                                   R square (COD)  0.946 32
                80      1 742    6 396         0.106
                                                                      0
                                                                       0  10  20  30  40  50  60  70  80  90
                                                                                Total number of cycles
            外,为了详细表征闸片中各组元的损伤机制,开展了
                                                                Fig. 15    Fitting of correlation between pin wear height and
            半原位磨损试验. 本文中结论具体如下:                                               number of cycle tests
                a. 销-环摩擦副在不同循环试验次数下的平均摩                          图 15    销磨损高度与循环试验次数之间的相关性拟合
   75   76   77   78   79   80   81   82   83   84   85