
Page 294 - 《高原气象》2026年第2期
P. 294
高 原 气 象 45 卷
594
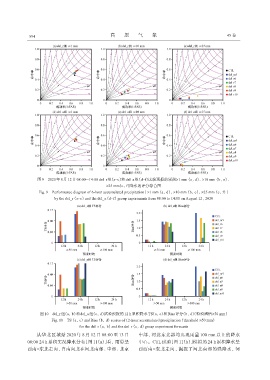
图9 2020年8月12日08:00 -14:00 del_r组(a~c)和del_a组(d~f)试验预报的累积≥1 mm (a, d)、 ≥10 mm (b, e)、
≥25 mm(c, f)降水的评分综合图
Fig. 9 Performance diagram of 6-hour accumulated precipitation [≥1 mm (a, d), ≥10 mm (b, e), ≥25 mm (c, f)]
by the del_r (a~c) and the del_a (d~f) group experiments from 08:00 to 14:00 on August 12, 2020
图10 del_r组(a, b)和del_a组(c, d)试验预报的12 h累积降水TS(a, c)和Bias评分(b, d)(检验阈值≥50 mm)
Fig. 10 TS (a, c) and Bias (b, d) scores of 12-hour accumulated precipitation (threshold ≥50 mm)
for the del_r (a, b) and the del_r (c, d) group experiment forecasts
从华北区域站 2020 年 8 月 12 日 08:00 至 13 日 中部、 河北东北部均出现雨量 100 mm 以上的降水
08:00 24 h 累积实况降水分布[图 11(a)]看, 雨带呈 中心。CTL 试验[图 11(b)]模拟的 24 h 累积降水呈
西南-东北走向, 自南向北在河北南部、 中部、 北京 西西南-东北走向, 漏报了河北南部的强降水, 河