Page 169 - 《高原气象》2022年第5期
P. 169

高     原      气     象                                 41 卷
              1262


                                                                        -1
                                                                                        -1
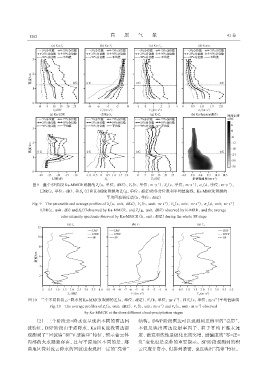
                图9   整个SP阶段Ka-MMCR观测的Z(a,单位:dBZ)、V(b,单位:m·s )、V(c,单位:m·s )、σ(d,单位:m·s )、
                                                                                                        -1
                                                                                             v
                                              e
                                                            T
                                                                            A
                   LDR(e,单位:dB)、和S (f)和K-MRR观测的Z(g,单位:dBZ)的各分位数和平均值廓线,Ka-MMCR观测的
                                      K
                                                        e
                                                 平均回波强度谱(h,单位:dBZ)
                                                                            -1
                                                                                          -1
                                                                                                          -1
                Fig. 9  The percentile and average profiles of Z(a,unit:dBZ),V(b,unit:m·s ),V(c,unit:m·s ),σ(d,unit:m·s )
                                                                 T
                                                                                A
                                                                                               v
                                                  e
                   LDR(e,unit:dB)and S(f)observed by Ka-MMCR,and Z(g,unit:dBZ)observed by K-MRR,and the average
                                                                e
                                      K
                             echo intensity spectrum observed by Ka-MMCR(h,unit:dBZ)during the whole SP stage


                                                                                                   -1
                                                                                 -1
              图10  三个不同阶段云-降水的Ka-MMCR观测的Z(a,单位:dBZ)、V(b,单位:m·s )、和V(c,单位:m·s )平均值廓线
                                                                                       A
                                                                     T
                                                      e
                                                                                           -1
                                                                          -1
                       Fig. 10  The average profiles of Z(a,unit:dBZ),V(b,unit:m·s )and V(c,unit:m·s )observed
                                                 e
                                                               T
                                                                                A
                                       by Ka-MMCR at the three different cloud-precipitation stages
                 (2) 三个阶段云-降水也呈现出不同的雷达回                         结构。DWP阶段雷达可以观测到更典型的“亮带”,
             波特征,DSP 阶段由于强降水,Ka和 K 波段雷达都                        不仅反映出雷达反射率因子、粒子平均下落末速
             观测到了“回波墙”和“V 型缺口”特征,预示着云体                          度、谱宽和线性退极化比的突增,谱偏度的“零-正-
             内部的大水凝物存在,且与平原地区不同的是,那                             负”变化也是亮带的重要指示。SP阶段观测到的积
             曲地区深对流云降水的回波也表现出一定的“亮带”                            云尺度非常小,但排列紧密,也反映出“亮带”特征。
   164   165   166   167   168   169   170   171   172   173   174