
Page 185 - 《爆炸与冲击》2026年第5期
P. 185
第 46 卷 韩思豪,等: 机器学习驱动的折纸超材料夹芯结构低速冲击响应预测及多目标优化 第 5 期
表 2 折纸超材料夹芯复合结构低速冲击响应及破坏模式对比
Table 2 Comparison of low-velocity impact response and failure modes of origami metamaterial sandwiches
超材料夹芯复合结构 F P /kN t P /ms E a /J ρ eff 破坏模式
α=20°, β=20°, θ=20° 16.97 2.70 10.04 0.244 7 未破坏
Θ 1
α=20°, β=30°, θ=20° 12.34 1.93 17.44 0.254 9 折痕渐进压溃
Θ 2
内凹蜂窝 瞬时完全断裂
Θ 3 8.43 2.05 17.43 0.215 5
星形蜂窝 8.32 1.93 17.87 0.271 3 瞬时完全断裂
Θ 4
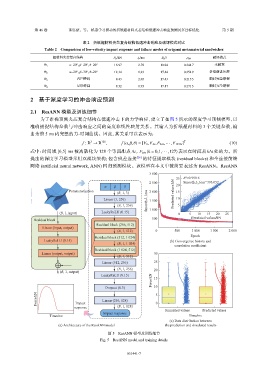
2 基于深度学习的冲击响应预测
2.1 ResANN 模型及训练细节
为了准确预测夹芯复合结构在低速冲击下的力学响应,建立了如图 5 所示的深度学习预测模型,以
准确捕捉结构参数与冲击响应之间的高度非线性映射关系。其输入为折纸超材料的 3 个关键参数,输
出为前 5 ms 内完整的力-时间曲线。因此,其关系可以表示为:
f : R → R , f (α,β,θ) = [F 0 ,F ∆t ,F 2∆t ,··· ,F 127∆t ] T (10)
128
3
式中:时间域 [0,5] ms 被离散化为 128 个等间距点 ∆t F k∆t (k = 0,1,··· ,127) 表示在时间点 k∆t 处的力。所
,
提出的深度学习模型采用双模块架构:包含残差连接 [26] 的特征提取模块 (residual blocks) 和全连接前馈
网络 (artificial neural network, ANN) 回归预测模块。该模型在本文中被简要表述为 ResANN。ResANN
3 000
25 R =0.990 6
2
2 500 Smooth L 1 loss=393.052
α β θ 20
Parameterization (B, 1, 3) 2 000 Predicted values/kN 15
Linear (3, 256) Smooth L 1 loss 1 500 10
(B, 1, 256) 5
(B, 1, input) LeakyReLU (0.15) 1 000 0 5 10 15 20 25
Residual block 500 Simulated values/kN
Residual block (256, 512)
Linear (input, output)
(B, 1, 512) 0 500 1 000 1 500 2 000
Residual block (512, 1 024) Epoch
LeakyReLU (0.15) (b) Convergence history and
(B, 1, 1 024) correlation coefficient
Residual block (1 024, 512)
Linear (output, output) 30
(B, 1, 512)
Linear (512, 256) 25
(B, 1, 256) 20
(B, 1, output)
LeakyReLU (0.15) 15
Force/kN
Dropout (0.3) 10
Force/kN Impact Linear (256, 128) 5 0
response (B, 1, 128)
Impact response Simulated values Predicted values
Time/ms Time/ms
(c) Data distribution between
(a) Architecture of the ResANN model the prediction and simulated results
图 5 ResANN 模型及训练细节
Fig. 5 ResANN model and training details
051441-7