Page 198 - 《爆炸与冲击》2026年第3期
P. 198

第 46 卷             廖祜明,等: 预测不同冲击载荷下弹药响应特性的HOTM方法                                第 3 期

                                Central axis

                                                   2.0                                 500   100
                                                                                    λ
                                                   1.5                              T        80
                       Measuring                                                    p  450
                         point                     1.0                                       60
                                                                                       400
                                           292 mm  λ  0.5 0                            350  T/K  40  p/MPa

                                                                                             20
                                                  −0.5                                 300   0

                                                  −1.0                                 250   −20
                         Bottom                        0    50  100  150  200  250  300
                                                       Distance from the bottom of the explosive/mm
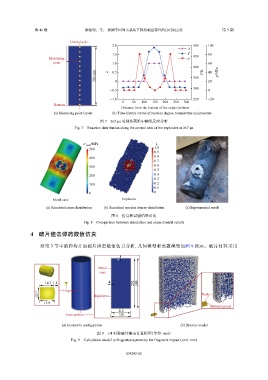
                         (a) Measuring point layout  (b) Time-history curves of reaction degree, temperature and pressure
                                             图 7    267 μs 时刻炸药沿中轴线反应分布
                                  Fig. 7    Reaction distribution along the central axis of the explosive at 267 μs


                                      σ equiv /MPa                    λ
                                         500                          1.0
                                                                      0.9
                                         400                          0.8
                                                                      0.7
                                         300                          0.6
                                                                      0.5
                                         200                          0.4
                                                                      0.3
                                         100                          0.2
                                                                      0.1
                                         0                            0
                        Metal case                     Explosive
                     (a) Simulated stress distribution   (b) Simulated reaction degree distribution  (c) Experimental result
                                                   图 8    仿真和试验结果对比
                                      Fig. 8    Comparison between simulation and experimental results

                4    破片撞击弹药数值仿真


                   对第   3  节中的弹药开展破片撞击数值仿真分析,几何模型和离散模型如图                              9  所示。破片材料采用

                                                      4
                                             Metal
                                             case

                     14.7 1.1                    4          292  300
                             Fragment
                  12.7                     Explosive                                       Node
                     15.8
                                                                                              Material point
                                                      112
                              Ammunition              120

                             (a) Geometric configuration                         (b) Discrete model

                                            图 9    1/4  对称破片撞击计算模型(单位:mm)
                                 Fig. 9    Calculation model with quarter-symmetry for fragment impact (unit: mm)


                                                         034202-12
   193   194   195   196   197   198   199   200   201   202   203