
Page 62 - 《爆炸与冲击》2026年第01期
P. 62
第 46 卷 郭开岭,等: 铝蜂窝夹芯板入水冲击动态响应特性实验研究 第 1 期
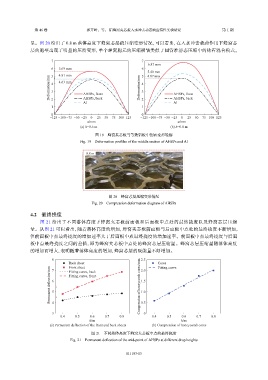
显。图 20 给出了 0.8 m 落体高度下蜂窝芯层的压缩变形情况,可以看出,在入水冲击载荷作用下蜂窝芯
层的胞壁出现了明显的压溃变形,单个蜂窝胞元的压缩褶皱类似于圆管准静态压缩中的钻石混合模式。
7 7
6.87 mm
6 5.69 mm 6
5.40 mm
4.81 mm
5
5
4.87 mm
Deformation/mm 4 3 4.63 mm AHSPs, front Deformation/mm 4 3 AHSPs, front
AHSPs, back
2
Al 2 AHSPs, back
Al
1 1
0 0
−125 −100 −75 −50 −25 0 25 50 75 100 125 −125 −100 −75 −50 −25 0 25 50 75 100 125
x/mm x/mm
(a) h=0.6 m (b) h=0.8 m
图 19 蜂窝夹芯板与等效铝板中剖面变形轮廓
Fig. 19 Deformation profiles of the middle section of AHSPs and Al
0.8 m
图 20 蜂窝芯层压缩变形情况
Fig. 20 Compression deformation diagram of AHSPs
4.2 最终挠度
图 21 给出了不同落体高度下蜂窝夹芯板前面板和后面板中点处的最终挠度以及蜂窝芯层压缩
量。从图 21 可以看出,随着落体高度的增加,蜂窝夹芯板前面板与后面板中点处的最终挠度不断增加,
但前面板中点最终挠度的增加速率大于后面板中点最终挠度的增加速率。前面板中点最终挠度与后面
板中点最终挠度之间的差值,即为蜂窝夹芯板中点处的蜂窝芯层压缩量。蜂窝芯层压缩量随落体高度
的增加而增大,表明随着落体高度的增加,蜂窝芯层的吸能量不断增加。
8 2.5
Back sheet 2.0 Cores
Fitting curve
Front sheet
Permanent deflection/mm 6 5 Fitting curve, front Compression of honeycomb cores/mm 1.5
Fitting curve, back
7
1.0
3 4 0.5 0
0.4 0.5 0.6 0.7 0.8 0.4 0.5 0.6 0.7 0.8
h/m h/m
(a) Permanent deflection of the front and back sheets (b) Compression of honeycomb cores
图 21 不同落体高度下蜂窝夹芯板中点的最终挠度
Fig. 21 Permanent deflection of the mid-point of AHSPs at different drop heights
011103-13