
Page 11 - 《渔业研究》2026年第2期
P. 11
154 渔 业 研 究 第 48 卷
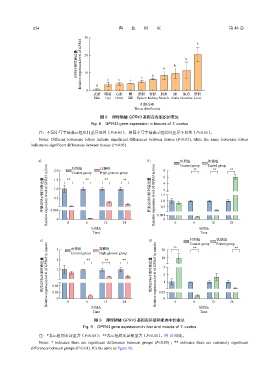
30 a
GPR43相对表达量 Relative expression level of GPR43 20 b b b b
10
0 d c c c c
皮肤 眼睛 心脏 鰓 脾脏 肾脏 肌肉 脑 肠道 肝脏
Skin Eye Heart Gill Spleen Kidney Muscle Brain Intestine Liver
组织分布
Tissue distribution
图 8 卵形鲳鲹 GPR43 基因在各组织的表达
Fig. 8 GPR43 gene expression in tissues of T. ovatus
注:不同小写字母表示组织间差异显著(P<0.05) ,相同小写字母表示组织间差异不显著(P>0.05) 。
Notes: Different lowercase letters indicate significant differences between tissues (P<0.05), while the same lowercase letters
indicate no significant differences between tissues (P>0.05).
a) 2.0 对照组 高糖组 b) 8 6 对照组 ** 饥饿组 **
Fasted group
Control group
**
High‑glucose group
Control group
肝脏GPR43相对表达量 Relative expression level of GPR43 in liver 0.003 ** ** ** ** 肝脏GPR43相对表达量 Relative expression level of GPR43 in liver 1.5 4 2
1.5
1.0
0.5
1.0
0.5
0
0
6
时间/h 12 24 0.001 0 0 6 时间/h 12 24
Time Time
c) 3 对照组 高糖组 d) 20 ** 对照组 饥饿组 **
Fasted group
Control group
**
High‑glucose group
Control group
肌肉GPR43相对表达量 Relative expression level of GPR43 in muscle 0.04 2 1 ** ** ** 肌肉GPR43相对表达量 Relative expression level of GPR43 in muscle 10 3 2 1
0.02
0
0
6
时间/h 12 24 0.02 0 0 6 时间/h 12 24
Time Time
图 9 卵形鲳鲹 GPR43 基因在肝脏和肌肉中的表达
Fig. 9 GPR43 gene expression in liver and muscle of T. ovatus
注:*表示组间差异显著(P<0.05) ;**表示组间差异极显著(P<0.01) 。图 10 同此。
Notes: * indicates there are significant differences between groups (P<0.05) ; ** indicates there are extremely significant
differences between groups (P<0.01). It’s the same as figure 10.