
Page 67 - 《运动与健康科学》(英文)2024年第2期
P. 67
TaggedAPTARAFigure TaggedAPTARAEndStretch training effects on flexibility 189
Fig. 1. Preferred Reporting Items for Systematic reviews and Meta-Analyses flowchart. ROM = range of motion.TaggedAPTARAEnd
2
pronounced in females (ES = 1.55) compared to males showed no relationship between the ESs for age (R = 0.03;
2
p = 0.400), total stretch duration (R = 0.03; p = 0.730), or
(ES = 0.88).TaggedAPTARAEnd
2
TaggedAPTARAPMoreover, Q statistics indicated a significant difference stretch frequency per week (R = 0.02; p = 0.420), respec-
between the stretching techniques (p = 0.012). Further compar- tively.TaggedAPTARAEnd
ison showed no significant difference between static and PNF
stretching techniques (p = 0.28) but a significantly greater
TaggedAPTARAH14. DiscussionTaggedAPTARAEnd
ROM effect for static (p = 0.01) and PNF (p = 0.01) compared
to ballistic/dynamic stretching, respectively. Further subgroup TaggedAPTARAPThe major finding of this meta-analysis was a main effect,
analyses revealed no significant difference in the Q statistics overall, moderate magnitude (ES = 1.002; p < 0.001)
for the muscles tested (p = 0.134), intensity of stretch increase in ROM compared to controls. Subgroup analysis
(p = 0.540), trained state of the participants (p = 0.742), indicated a significant difference in the effects between sexes
stretching techniques (p = 0.012), and supervision of the and stretching techniques. However, further moderating analyses
stretching intervention (p = 0.172). Furthermore, meta-regression showed no other significant relationships or differences.TaggedAPTARAEnd
TaggedAPTARAFigure
TaggedAPTARAPThe finding of the main meta-analysis is in agreement with
other meta-analyses 35,36 as well as other reviews 37 on the
effects of stretch training on ROM. Moreover, subgroup analysis
indicated a significant difference between the various stretching
techniques (p = 0.012). Further pairwise comparison showed
significantly greater ROM increases for PNF and static
stretching compared to ballistic/dynamic stretching, respectively.
However, there was no significant difference between static
stretching and PNF stretching, although the ES for PNF
stretching was slightly higher (ES = 1.280) compared to static
stretching (ES = 1.005). These results are in accordance with a
previous meta-analysis, 35 although PNF stretching provided a
more pronounced increase compared to static stretching (mean
difference of straight leg raise test 2.56˚; p = 0.30).
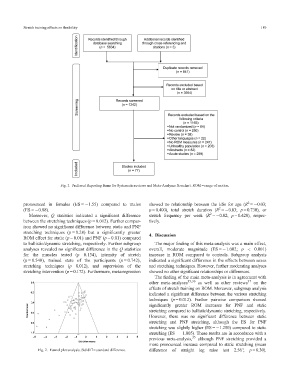
Fig. 2. Funnel plot analysis. Std diff = standard difference.TaggedAPTARAEnd