
Page 17 - 《运动与健康科学》(英文)2024年第2期
P. 17
TaggedAPTARAFigure
TaggedAPTARAEndPhysical activity and amyloid beta 139
a
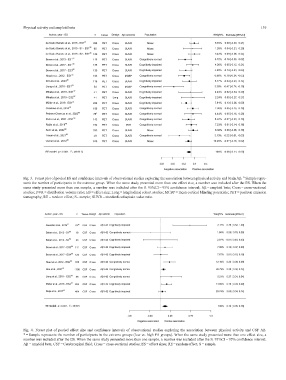
Fig. 3. Forest plot of pooled ES and confidence intervals of observational studies exploring the association between physical activity and brain Ab. Sample repre-
sents the number of participants in the extreme group. When the same study presented more than one effect size, a number was included after the ES. When the
same study presented more than one sample, a number was included after the S. 95%CI = 95% confidence interval; Ab = amyloid beta; Cross = cross-sectional
studies; DVR = distribution volume ratio; ES = effect size; Long = longitudinal cohort studies; MCBP = mean cortical blinding potentials; PET = positron emission
tomography; RE = random effect; S= sample; SUVR = standardized uptake value ratio.TaggedAPTARAEnd
TaggedAPTARAFigure
Fig. 4. Forest plot of pooled effect size and confidence intervals of observational studies exploring the association between physical activity and CSF Ab.
* = Sample represents the number of participants in the extreme groups (low vs. high PA groups). When the same study presented more than one effect size, a
number was included after the ES. When the same study presented more than one sample, a number was included after the S. 95%CI = 95% confidence interval;
Ab = amyloid beta; CSF = Cerebrospinal fluid; Cross = cross-sectional studies; ES = effect sizes; RE = random effect; S = sample.TaggedAPTARAEnd