
Page 106 - 《运动与健康科学》(英文)2024年第2期
P. 106
TaggedAPTARAEnd228 X. Jin et al.
(p nonlinearity = 0.452) were noted. A higher PA at any intensity combinations of high PA volume and long sleep duration
was associated with a lower risk of incident type 2 diabetes: (HR = 0.90, 95%CI: 0.671.22), recommended MVPA and
high volume of PA (vs. low volume of PA): HR = 0.67, normal sleep duration (reference group), and high LPA and
95%CI: 0.600.76; recommended MVPA (vs. not recom- long sleep duration (HR = 0.92, 95%CI: 0.711.19). None of
mended MVPA): HR = 0.61, 95%CI: 0.540.70; high LPA the multiplicative or additive interactions attained statistical
significance (Supplementary Tables 8 and 9); nevertheless,
(vs. low LPA): HR = 0.85, 95%CI: 0.770.95) (Table 2).TaggedAPTARAEnd
they were consistent in the direction of positive multiplicative
and positive additive interactions.TaggedAPTARAEnd
TaggedAPTARAH23.3. Subgroup analyses and joint association of
accelerometer-measured sleep duration and PA with incident
TaggedAPTARAH23.4. Sensitivity analysesTaggedAPTARAEnd
type 2 diabetesTaggedAPTARAEnd
TaggedAPTARAPThe results of most sensitivity analyses remained robust
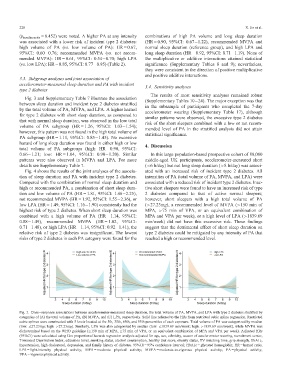
TaggedAPTARAPFig. 3 and Supplementary Table 7 illustrate the association
(Supplementary Tables 1024). The major exception was that
between sleep duration and incident type 2 diabetes stratified
in the subsample of participants who completed the 7-day
by the total volume of PA, MVPA, and LPA. A higher hazard
accelerometer wearing (Supplementary Table 17), although
for type 2 diabetes with short sleep duration, as compared to
similar patterns were observed, the excessive type 2 diabetes
that with normal sleep duration, was observed in the low total
risk of the short sleepers combined with a low or not recom-
volume of PA subgroup (HR = 1.26, 95%CI: 1.031.54);
mended level of PA in the stratified analysis did not attain
however, this pattern was not found in the high total volume of
statistical significance.TaggedAPTARAEnd
PA subgroup (HR = 1.11, 95%CI: 0.851.45). No excessive
hazard of long sleep duration was found in either high or low
TaggedAPTARAH14. DiscussionTaggedAPTARAEnd
total volume of PA subgroups (high: HR = 0.90, 95%CI:
0.661.21; low: HR = 1.04, 95%CI: 0.901.20). Similar TaggedAPTARAPIn this large population-based prospective cohort of 88,000
patterns were also observed in MVPA and LPA. For more middle-aged UK participants, accelerometer-measured short
(<6 h/day) but not long sleep duration (>8 h/day) was associ-
details see Supplementary Table 7.TaggedAPTARAEnd
TaggedAPTARAPFig. 4 shows the results of the joint analyses of the associa- ated with an increased risk of incident type 2 diabetes. All
tion of sleep duration and PA with incident type 2 diabetes. intensities of PA (total volume of PA, MVPA, and LPA) were
Compared with the combination of normal sleep duration and associated with a reduced risk of incident type 2 diabetes. Inac-
high or recommended PA, a combination of short sleep dura- tive short sleepers were found to have an increased risk of type
tion and low volume of PA (HR = 1.81, 95%CI: 1.462.25), 2 diabetes compared to that of active normal sleepers;
not recommended MVPA (HR = 1.92, 95%CI: 1.552.36), or however, short sleepers with a high total volume of PA
low LPA (HR = 1.49, 95%CI: 1.161.90) consistently had the (>27.23mg), a recommended level of MVPA (>150 min of
highest risk of type 2 diabetes. When short sleep duration was MPA, >75 min of VPA, or an equivalent combination of
combined with a high volume of PA (HR = 1.14, 95%CI: MPA and VPA per week), or a high level of LPA (>1839.69
0.881.49), recommended MVPA (HR = 1.02, 95%CI: min/week) did not have this excessive risk. These findings
0.711.48), or high LPA (HR = 1.14, 95%CI: 0.921.41), the suggest that the detrimental effect of short sleep duration on
relative risk of type 2 diabetes was insignificant. The lowest type 2 diabetes could be mitigated by any intensity of PA that
risks of type 2 diabetes in each PA category were found for the reached a high or recommended level.TaggedAPTARAEnd
TaggedAPTARAFigure
Fig. 3. Doseresponse associations between accelerometer-measured sleep duration, the total volume of PA, MVPA, and LPA with type 2 diabetes stratified by
categories of (A) the total volume of PA, (B) MVPA, and (C) LPA, respectively. Solid line referred to the HRs from restricted cubic spline regression. Restricted
cubic splines were constructed with 5 knots located at the 5th, 35th, 65th, and 95th percentiles of each exposure. Total volume of PA was categorized by median
(low: 27.23mg; high: >27.23mg). Similarly, LPA was also categorized by median (low: 1839.69 min/week; high: >1839.69 min/week), while MVPA was
dichotomized based on the WHO guideline (150 min of MPA, 75 min of VPA, or an equivalent combination of MPA and VPA per week). Adjusted HRs
(95%CI) were calculated using Cox proportional hazards regression analysis adjusted for age, sex, ethnicity, season of accelerometer wearing, recruitment center,
Townsend Deprivation Index, education level, smoking status, alcohol consumption, healthy diet score, obesity status, TV watching time, grip strength, HbA1c,
hypertension, high cholesterol, depression, and family history of diabetes. 95%CI = 95% confidence interval; HbA1c = glycated hemoglobin; HR = hazard ratio;
LPA = light-intensity physical activity; MPA = moderate physical activity; MVPA = moderate-to-vigorous physical activity; PA = physical activity;
VPA = vigorous physical activity.TaggedAPTARAEnd