
Page 104 - 《运动与健康科学》(英文)2024年第2期
P. 104
TaggedAPTARAEnd226 X. Jin et al.
TaggedAPTARATableTable 1
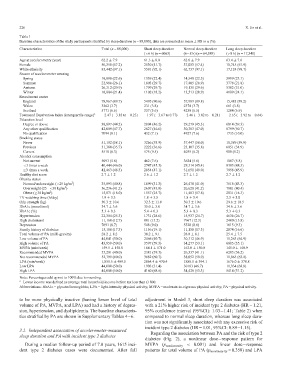
TaggedAPTARACaptionBaseline characteristics of the study participants stratified by sleep duration (n = 88,000), data are presented as mean § SD or n (%). TaggedAPTARAEnd
CharacteristicsTaggedAPTARAEnd Total (n = 88,000) Short sleep duration Normal sleep duration Long sleep duration
(<6h)(n = 6063)TaggedAPTARAEnd (68h)(n = 64,589)TaggedAPTARAEnd (>8h) (n = 17,348)TaggedAPTARAEndTaggedAPTARAEndTaggedAPTARAEndTaggedAPTARATbody
Age at accelerometry (year)TaggedAPTARAEnd 62.2 § 7.9TaggedAPTARAEnd 61.3 § 8.0TaggedAPTARAEnd 62.0 § 7.9TaggedAPTARAEnd 63.4 § 7.6TaggedAPTARAEndTaggedAPTARAEnd
FemaleTaggedAPTARAEnd 50,358 (57.2)TaggedAPTARAEnd 2530 (41.7)TaggedAPTARAEnd 37,083 (57.4)TaggedAPTARAEnd 10,745 (61.9)TaggedAPTARAEndTaggedAPTARAEnd
White ethnicityTaggedAPTARAEnd 85,442 (97.1)TaggedAPTARAEnd 5581 (92.1)TaggedAPTARAEnd 62,737 (97.1)TaggedAPTARAEnd 17,124 (98.7)TaggedAPTARAEndTaggedAPTARAEnd
Season of accelerometer wearingTaggedAPTARAEnd TaggedAPTARAEnd
SpringTaggedAPTARAEnd 19,898 (22.6)TaggedAPTARAEnd 1359 (22.4)TaggedAPTARAEnd 14,540 (22.5)TaggedAPTARAEnd 3999 (23.1)TaggedAPTARAEndTaggedAPTARAEnd
SummerTaggedAPTARAEnd 22,986 (26.1)TaggedAPTARAEnd 1803 (29.7)TaggedAPTARAEnd 17,405 (26.9)TaggedAPTARAEnd 3778 (21.8)TaggedAPTARAEndTaggedAPTARAEnd
AutumnTaggedAPTARAEnd 26,312 (29.9)TaggedAPTARAEnd 1799 (29.7)TaggedAPTARAEnd 19,131 (29.6)TaggedAPTARAEnd 5382 (31.0)TaggedAPTARAEndTaggedAPTARAEnd
WinterTaggedAPTARAEnd 18,804 (21.4)TaggedAPTARAEnd 1102 (18.2)TaggedAPTARAEnd 13,513 (20.9)TaggedAPTARAEnd 4189 (24.1)TaggedAPTARAEndTaggedAPTARAEnd
Recruitment centerTaggedAPTARAEnd TaggedAPTARAEnd
EnglandTaggedAPTARAEnd 78,967 (89.7)TaggedAPTARAEnd 5495 (90.6)TaggedAPTARAEnd 57,989 (89.8)TaggedAPTARAEnd 15,483 (89.2)TaggedAPTARAEndTaggedAPTARAEnd
WalesTaggedAPTARAEnd 3262 (3.7)TaggedAPTARAEnd 231 (3.8)TaggedAPTARAEnd 2370 (3.7)TaggedAPTARAEnd 661 (3.8)TaggedAPTARAEndTaggedAPTARAEnd
ScotlandTaggedAPTARAEnd 5771 (6.6)TaggedAPTARAEnd 337 (5.6)TaggedAPTARAEnd 4230 (6.5)TaggedAPTARAEnd 1204 (6.9)TaggedAPTARAEndTaggedAPTARAEnd
a
Townsend Deprivation Index (interquartile range) TaggedAPTARAEnd 2.47 (3.83 to 0.23)TaggedAPTARAEnd 1.97 (3.67 to 0.77)TaggedAPTARAEnd 2.46 (3.82 to 0.21)TaggedAPTARAEnd 2.65 (3.92 to 0.64)TaggedAPTARAEndTaggedAPTARAEnd
Education levelTaggedAPTARAEnd TaggedAPTARAEnd
Degree or aboveTaggedAPTARAEnd 38,897 (44.2)TaggedAPTARAEnd 2804 (46.2)TaggedAPTARAEnd 29,279 (45.3)TaggedAPTARAEnd 6814 (39.3)TaggedAPTARAEndTaggedAPTARAEnd
Any other qualificationTaggedAPTARAEnd 42,009 (47.7)TaggedAPTARAEnd 2827 (46.6)TaggedAPTARAEnd 30,383 (47.0)TaggedAPTARAEnd 8799 (50.7)TaggedAPTARAEndTaggedAPTARAEnd
No qualificationTaggedAPTARAEnd 7094 (8.1)TaggedAPTARAEnd 432 (7.1)TaggedAPTARAEnd 4927 (7.6)TaggedAPTARAEnd 1735 (10.0)TaggedAPTARAEndTaggedAPTARAEnd
Smoking statusTaggedAPTARAEnd TaggedAPTARAEnd
NeverTaggedAPTARAEnd 51,102 (58.1)TaggedAPTARAEnd 3266 (53.9)TaggedAPTARAEnd 37,447 (58.0)TaggedAPTARAEnd 10,389 (59.9)TaggedAPTARAEndTaggedAPTARAEnd
PreviousTaggedAPTARAEnd 31,380 (35.7)TaggedAPTARAEnd 2222 (36.6)TaggedAPTARAEnd 23,107 (35.8)TaggedAPTARAEnd 6051 (34.9)TaggedAPTARAEndTaggedAPTARAEnd
CurrentTaggedAPTARAEnd 5518 (6.3)TaggedAPTARAEnd 575 (9.5)TaggedAPTARAEnd 4035 (6.2)TaggedAPTARAEnd 908 (5.2)TaggedAPTARAEndTaggedAPTARAEnd
Alcohol consumptionTaggedAPTARAEnd TaggedAPTARAEnd
Not currentTaggedAPTARAEnd 5093 (5.8)TaggedAPTARAEnd 462 (7.6)TaggedAPTARAEnd 3624 (5.6)TaggedAPTARAEnd 1007 (5.8)TaggedAPTARAEndTaggedAPTARAEnd
<3 times a weekTaggedAPTARAEnd 40,444 (46.0)TaggedAPTARAEnd 2747 (45.3)TaggedAPTARAEnd 29,314 (45.4)TaggedAPTARAEnd 8383 (48.3)TaggedAPTARAEndTaggedAPTARAEnd
3 times a weekTaggedAPTARAEnd 42,463 (48.3)TaggedAPTARAEnd 2854 (47.1)TaggedAPTARAEnd 31,651 (49.0)TaggedAPTARAEnd 7958 (45.9)TaggedAPTARAEndTaggedAPTARAEnd
Healthy diet scoreTaggedAPTARAEnd 2.7 § 1.2TaggedAPTARAEnd 2.6 § 1.2TaggedAPTARAEnd 2.7 § 1.2TaggedAPTARAEnd 2.7 § 1.2TaggedAPTARAEndTaggedAPTARAEnd
Obesity statusTaggedAPTARAEnd TaggedAPTARAEnd
2
Normal/underweight (<25 kg/m )TaggedAPTARAEnd 35,893 (40.8)TaggedAPTARAEnd 1899 (31.3)TaggedAPTARAEnd 26,478 (41.0)TaggedAPTARAEnd 7516 (43.3)TaggedAPTARAEndTaggedAPTARAEnd
2
Overweight (25<30 kg/m )TaggedAPTARAEnd 36,236 (41.2)TaggedAPTARAEnd 2607 (43.0)TaggedAPTARAEnd 26,628 (41.2)TaggedAPTARAEnd 7001 (40.4)TaggedAPTARAEndTaggedAPTARAEnd
2
Obese (30 kg/m )TaggedAPTARAEnd 15,871 (18.0)TaggedAPTARAEnd 1557 (25.7)TaggedAPTARAEnd 11,483 (17.8)TaggedAPTARAEnd 2831 (16.3)TaggedAPTARAEndTaggedAPTARAEnd
TV watching time (h/day)TaggedAPTARAEnd 1.9 § 3.3TaggedAPTARAEnd 1.8 § 3.5TaggedAPTARAEnd 1.8 § 3.4TaggedAPTARAEnd 2.3 § 3.0TaggedAPTARAEndTaggedAPTARAEnd
Grip strength (kg)TaggedAPTARAEnd 30.3 § 10.6TaggedAPTARAEnd 32.3 § 11.0TaggedAPTARAEnd 30.3 § 10.6TaggedAPTARAEnd 29.6 § 10.5TaggedAPTARAEndTaggedAPTARAEnd
HbA1c (mmol/mol)TaggedAPTARAEnd 34.7 § 3.6TaggedAPTARAEnd 35.0 § 3.8TaggedAPTARAEnd 34.7 § 3.6TaggedAPTARAEnd 34.6 § 3.6TaggedAPTARAEndTaggedAPTARAEnd
HbA1c (%)TaggedAPTARAEnd 5.3 § 0.3TaggedAPTARAEnd 5.4 § 0.3TaggedAPTARAEnd 5.3 § 0.3TaggedAPTARAEnd 5.3 § 0.3TaggedAPTARAEndTaggedAPTARAEnd
HypertensionTaggedAPTARAEnd 22,304 (25.3)TaggedAPTARAEnd 1731 (28.6)TaggedAPTARAEnd 15,937 (24.7)TaggedAPTARAEnd 4636 (26.7)TaggedAPTARAEndTaggedAPTARAEnd
High cholesterolTaggedAPTARAEnd 11,168 (12.7)TaggedAPTARAEnd 801 (13.2)TaggedAPTARAEnd 7967 (12.3)TaggedAPTARAEnd 2400 (13.8)TaggedAPTARAEndTaggedAPTARAEnd
DepressionTaggedAPTARAEnd 7691 (8.7)TaggedAPTARAEnd 548 (9.0)TaggedAPTARAEnd 5528 (8.6)TaggedAPTARAEnd 1615 (9.3)TaggedAPTARAEndTaggedAPTARAEnd
Family history of diabetesTaggedAPTARAEnd 15,188 (17.3)TaggedAPTARAEnd 1156 (19.1)TaggedAPTARAEnd 11,158 (17.3)TaggedAPTARAEnd 2874 (16.6)TaggedAPTARAEndTaggedAPTARAEnd
Total volume of PA (milli-gravity)TaggedAPTARAEnd 28.2 § 8.2TaggedAPTARAEnd 30.2 § 9.1TaggedAPTARAEnd 28.8 § 8.1TaggedAPTARAEnd 25.4 § 7.5TaggedAPTARAEndTaggedAPTARAEnd
Low volume of PATaggedAPTARAEnd 44,041 (50.0)TaggedAPTARAEnd 2466 (40.7)TaggedAPTARAEnd 30,312 (46.9)TaggedAPTARAEnd 11,263 (64.9)TaggedAPTARAEndTaggedAPTARAEnd
High volume of PATaggedAPTARAEnd 43,959 (50.0)TaggedAPTARAEnd 3597 (59.3)TaggedAPTARAEnd 34,277 (53.1)TaggedAPTARAEnd 6085 (35.1)TaggedAPTARAEndTaggedAPTARAEnd
MVPA (min/week)TaggedAPTARAEnd 159.5 § 150.0TaggedAPTARAEnd 164.1 § 171.0TaggedAPTARAEnd 163.0 § 150.0TaggedAPTARAEnd 145.0 § 140.9TaggedAPTARAEndTaggedAPTARAEnd
Recommended MVPATaggedAPTARAEnd 35,201 (40.0)TaggedAPTARAEnd 2381 (39.3)TaggedAPTARAEnd 26,537 (41.1)TaggedAPTARAEnd 6283 (36.2)TaggedAPTARAEndTaggedAPTARAEnd
Not recommended MVPATaggedAPTARAEnd 52,799 (60.0)TaggedAPTARAEnd 3682 (60.7)TaggedAPTARAEnd 38,052 (58.9)TaggedAPTARAEnd 11,065 (63.8)TaggedAPTARAEndTaggedAPTARAEnd
LPA (min/week)TaggedAPTARAEnd 1,858.5 § 409.5TaggedAPTARAEnd 2064.4 § 470.4TaggedAPTARAEnd 1888.1 § 394.1TaggedAPTARAEnd 1676.0 § 378.8TaggedAPTARAEndTaggedAPTARAEnd
Low LPATaggedAPTARAEnd 44,000 (50.0)TaggedAPTARAEnd 1903 (31.4)TaggedAPTARAEnd 30163 (46.7)TaggedAPTARAEnd 11,934 (68.8)TaggedAPTARAEndTaggedAPTARAEnd
High LPATaggedAPTARAEnd 44,000 (50.0)TaggedAPTARAEnd 4160 (68.6)TaggedAPTARAEnd 34,426 (53.3)TaggedAPTARAEnd 5414 (31.2)TaggedAPTARAEndTaggedAPTARAEndTaggedAPTARAEnd
Note: Percentages add up not to 100% due to rounding.TaggedAPTARAEnd
a
Lower income was defined as average total household income before tax less than £1800.
Abbreviations: HbA1c = glycated hemoglobin; LPA = light-intensity physical activity; MVPA = moderate-to-vigorous physical activity; PA = physical activity.
TaggedAPTARAEnd
to be more physically inactive (having lower level of total adjustment in Model 3, short sleep duration was associated
volume of PA, MVPA, and LPA) and had a history of depres- with a 21% higher risk of incident type 2 diabetes (HR = 1.21,
sion, hypertension, and dyslipidemia. The baseline characteris- 95% confidence interval (95%CI): 1.031.41; Table 2) when
compared to normal sleep duration, whereas long sleep dura-
tics stratified by PA are shown in Supplementary Tables 46.TaggedAPTARAEnd
tion was not significantly associated with any excessive risk of
incident type 2 diabetes (HR = 1.01, 95%CI: 0.891.15).TaggedAPTARAEnd
TaggedAPTARAH23.2. Independent association of accelerometer-measured
TaggedAPTARAPRegarding the association between PA and the risk of type 2
sleep duration and PA with incident type 2 diabetesTaggedAPTARAEnd
diabetes (Fig. 2), a nonlinear doseresponse pattern for
TaggedAPTARAPDuring a median follow-up period of 7.0 years, 1615 inci- MVPA (p nonlinearity < 0.001) and linear doseresponse
dent type 2 diabetes cases were documented. After full patterns for total volume of PA (p nonlinearity = 0.358) and LPA