
Page 105 - 《运动与健康科学》(英文)2024年第2期
P. 105
TaggedAPTARAEndSleep, physical activity, and type 2 diabetes 227
TaggedAPTARATableTable 2
TaggedAPTARACaptionAssociations of accelerometer-measured sleep duration and PA with incident type 2 diabetes (n = 88,000) TaggedAPTARAEnd
Incidence rate (%)/per Model 1 Model 2 Model 3
Events/nTaggedAPTARAEnd
1000 person-years HR (95%CI)TaggedAPTARAEnd HR (95%CI)TaggedAPTARAEnd HR (95%CI)TaggedAPTARAEndTaggedAPTARAEndTaggedAPTARAEndTaggedAPTARATbody
Sleep durationTaggedAPTARAEnd TaggedAPTARAEnd
Normal sleep durationTaggedAPTARAEnd 1129/64,589TaggedAPTARAEnd 2.5TaggedAPTARAEnd 1.00 (Reference)TaggedAPTARAEnd 1.00 (Reference)TaggedAPTARAEnd 1.00 (Reference)TaggedAPTARAEndTaggedAPTARAEnd
Short sleep durationTaggedAPTARAEnd 181/6063TaggedAPTARAEnd 4.4TaggedAPTARAEnd 1.64 (1.401.92)TaggedAPTARAEnd 1.22 (1.041.43)TaggedAPTARAEnd 1.21 (1.031.41)TaggedAPTARAEndTaggedAPTARAEnd
Long sleep durationTaggedAPTARAEnd 305/17,348TaggedAPTARAEnd 2.6TaggedAPTARAEnd 0.97 (0.861.11)TaggedAPTARAEnd 1.02 (0.901.16)TaggedAPTARAEnd 1.01 (0.891.15)TaggedAPTARAEndTaggedAPTARAEnd
Total volume of PATaggedAPTARAEnd TaggedAPTARAEnd
Low volume of PATaggedAPTARAEnd 1144/44,041TaggedAPTARAEnd 3.8TaggedAPTARAEnd 1.00 (Reference)TaggedAPTARAEnd 1.00 (Reference)TaggedAPTARAEnd 1.00 (Reference)TaggedAPTARAEndTaggedAPTARAEnd
High volume of PATaggedAPTARAEnd 471/43,959TaggedAPTARAEnd 1.5TaggedAPTARAEnd 0.47 (0.420.52)TaggedAPTARAEnd 0.65 (0.580.73)TaggedAPTARAEnd 0.67 (0.600.76)TaggedAPTARAEndTaggedAPTARAEnd
MVPATaggedAPTARAEnd TaggedAPTARAEnd
Not recommended MVPATaggedAPTARAEnd 1297/52,799TaggedAPTARAEnd 3.6TaggedAPTARAEnd 1.00 (Reference)TaggedAPTARAEnd 1.00 (Reference)TaggedAPTARAEnd 1.00 (Reference)TaggedAPTARAEndTaggedAPTARAEnd
Recommended MVPATaggedAPTARAEnd 318/35,201TaggedAPTARAEnd 1.3TaggedAPTARAEnd 0.37 (0.330.42)TaggedAPTARAEnd 0.59 (0.520.68)TaggedAPTARAEnd 0.61 (0.540.70)TaggedAPTARAEndTaggedAPTARAEnd
LPATaggedAPTARAEnd TaggedAPTARAEnd
Low LPATaggedAPTARAEnd 955/44,000TaggedAPTARAEnd 3.2TaggedAPTARAEnd 1.00 (Reference)TaggedAPTARAEnd 1.00 (Reference)TaggedAPTARAEnd 1.00 (Reference)TaggedAPTARAEndTaggedAPTARAEnd
High LPATaggedAPTARAEnd 660/44,000TaggedAPTARAEnd 2.2TaggedAPTARAEnd 0.76 (0.690.84)TaggedAPTARAEnd 0.84 (0.760.93)TaggedAPTARAEnd 0.85 (0.770.95)TaggedAPTARAEndTaggedAPTARAEndTaggedAPTARAEnd
Notes: Model 1 was adjusted for age and sex. Model 2 was adjusted for Model 1 plus ethnicity, season of accelerometer wearing, recruitment center, Townsend
Deprivation Index, education level, smoking status, alcohol consumption, healthy diet score, obesity status, TV watching time, grip strength, and HbA1c. Model 3
was adjusted for Model 2 plus hypertension, high cholesterol, depression, and family history of diabetes.
Abbreviations: 95%CI = 95% confidence interval; HR = hazard ratio; LPA = light-intensity physical activity; MVPA = moderate-to-vigorous physical activity;
PA = physical activity.TaggedAPTARAEnd
TaggedAPTARAEnd
TaggedAPTARAFigure
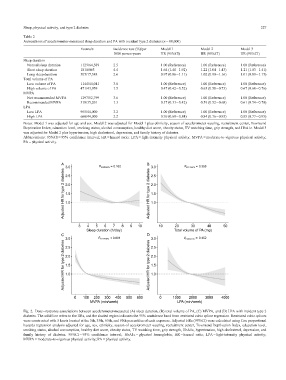
Fig. 2. Doseresponse associations between accelerometer-measured (A) sleep duration, (B) total volume of PA, (C) MVPA, and (D) LPA with incident type 2
diabetes. The solid line refers to the HRs, and the shaded region indicates the 95% confidence band from restricted cubic spline regression. Restricted cubic splines
were constructed with 5 knots located at the 5th, 35th, 65th, and 95th percentiles of each exposure. Adjusted HRs (95%CI) were calculated using Cox proportional
hazards regression analysis adjusted for age, sex, ethnicity, season of accelerometer wearing, recruitment center, Townsend Deprivation Index, education level,
smoking status, alcohol consumption, healthy diet score, obesity status, TV watching time, grip strength, HbA1c, hypertension, high cholesterol, depression, and
family history of diabetes. 95%CI = 95% confidence interval; HbA1c = glycated hemoglobin; HR = hazard ratio; LPA = light-intensity physical activity;
MVPA = moderate-to-vigorous physical activity; PA = physical activity.TaggedAPTARAEnd