Page 16 - 《水产学报》2026年第04期
P. 16

4 期                                     水    产    学    报                                 50 卷


                       N
                           2001                     2011                     2025
                      38°

                      36°

                      34°   6.8                      6.8                     6.8
                            3.6                      3.6                     3.6
                            0.4                      0.4                     0.4
                      32°   −2.8                     −2.8                    −2.8
                           120°  122°  124°  126°E  120°  122°  124°  126°E  120°  122°  124°  126°E
                                                             (a)

                       N
                           2001                     2011                     2025
                      38°


                      36°


                      34°   6.8                      6.8                     6.8
                            4.5                      4.5                     4.5
                            2.3                      2.3                     2.3
                      32°   0                        0                       0
                           120°  122°  124°  126°E  120°  122°  124°  126°E  120°  122°  124°  126°E
                                                             (b)

                                                                  第一线性预测器
                                            300                   1 st linear predictor
                                                                  第二线性预测器
                                                                  2 nd linear predictor
                                            200

                                       北向/km  northings  100
                                             0

                                           −100
                                           −200

                                           −300
                                               −300 −200 −100  0  100  200  300
                                                            东向/km
                                                            eastings

                                                              (c)
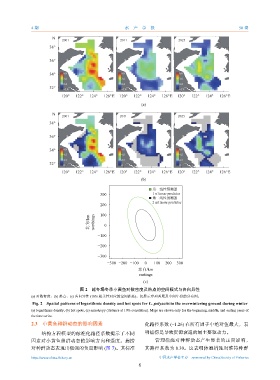
                                   图 2    越冬场冬季小黄鱼对数密度及热点的空间模式与各向异性
              (a) 对数密度,(b) 热点,(c) 各向异性 (10% 相关性对应的空间距离)。仅展示序列首尾及中间年份的分布图。
               Fig. 2 Spatial patterns of logarithmic density and hot spots for L. polyactis in the overwintering ground during winter
              (a) logarithmic density, (b) hot spots, (c) anisotropy (distance at 10% correlation). Maps are shown only for the beginning, middle, and ending years of
              the time series.
               2.3    小黄鱼种群动态的影响因素                             化路径系数 (–1.26) 在所有因子中绝对值最大,表

                   结构方程模型的标准化路径系数揭示了不同                         明捕捞是导致资源衰退的最主要驱动力。
              因素对小黄鱼种群动态的影响方向和强度。捕捞                                管理措施对种群动态产生显著的正面影响,
              对种群动态表现出极强的负面影响 (图                 7)。其标准        其路径系数为       0.30。这表明休渔措施对维持种群

              https://www.china-fishery.cn                           中国水产学会主办    sponsored by China Society of Fisheries
                                                            6
   11   12   13   14   15   16   17   18   19   20   21