Page 55 - 《水产学报》2025年第8期
P. 55

石今朝,等                                                                 水产学报, 2025, 49(8): 089405

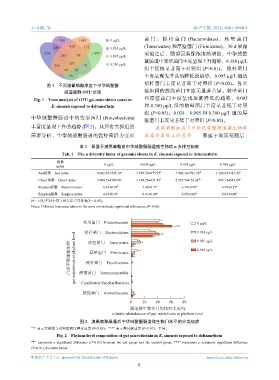
                                                               菌 门 、 拟 杆 菌 门     (Bacteroidetes)、 软 壁 菌 门
                         1 209     1 081        0 μg/L
                               410                             (Tenericutes) 和厚壁菌门    (Firmicutes)。30 d  暴露
                        486          117        0.024 μg/L
                    874                 1 495                  实验之后,随溴氰菊酯浓度的增加,中华绒螯
                           293    82            0.095 μg/L
                                                               蟹肠道中变形菌门丰度呈现上升趋势,0.380 μg/L
                               227              0.380 μg/L
                        256          91
                             42  39                            组丰度极显著高于对照组             (P<0.01)。 拟杆菌门
                               58                              丰度呈现先升高后降低的趋势,0.095 μg/L               组的

                                                               拟杆菌门丰度显著高于对照组                (P<0.05)。各实
                     图 1    不同溴氰菊酯浓度下中华绒螯蟹
                            肠道菌群    OTU  比较                    验组间的放线菌门丰度无显著差异。软壁菌门
                                                               和厚壁菌门丰度呈现逐渐降低的趋势,0.095
                Fig. 1 Venn analysis of OTU gut-microbiota count in
                       E. sinensis exposed to deltamethrin     和  0.380 μg/L  组的软壁菌门丰度显著低于对照
                                                               组  (P<0.05)。0.024、0.095  和  0.380 μg/L  组的厚
              中华绒螯蟹肠道中的变形菌门                  (Proteobacteria)
                                                               壁菌门丰度显著低于对照组              (P<0.05)。

              丰富度呈现上升的趋势            (图  2)。从所有实验组的                 溴氰菊酯胁迫下中华绒螯蟹肠道微生物群
              菌群分析,中华绒螯蟹肠道的优势菌群为变形                             在属分类级上的差异  暴露于溴氰菊酯后,


                                   表 1    暴露于溴氰菊酯后中华绒螯蟹肠道微生物的              α  多样性指数
                           Tab. 1    The α diversity index of gut-microbiota in E. sinensis exposed to deltamethrin
                         指数
                                              0 μg/L         0.024 μg/L       0.095 μg/L       0.380 μg/L
                         index
                 Ace指数 Ace index          4 082.76±745.10 a  3 746.50±975.95 a  3 002.16±781.36 ab  1 266.65±341.42 b
                 Chao1指数 Chao1 index      3 600.33±700.86 a  3 184.26±931.87 a  2 587.79± 74.24 ab  943.15±347.88 b
                 Shannon指数 Shannon index     6.67±0.93 a      7.42±0.71 a      6.79±0.99 a      6.79±0.57 a
                 Simpson指数 Simpson index     0.03±0.01 a      0.03±0.00 a      0.05±0.01 a      0.03±0.00 a
              注:同行不同小写字母表示差异显著(P < 0.05)。
              Notes: Different lowercase letters in the same row indicate significant differences (P<0.05).


                                    变形菌门 Proteobacteria                              0 μg/L
                                                                            **       0.024 μg/L
                                     拟杆菌门 Bacteroidetes
                                                                      *
                                                                                     0.095 μg/L
                                       软壁菌门 Tenericutes
                               门水平肠道微生物 gut microbiota at phylum level  疣微菌门 Verrucomicrobia  * * * *  0.380 μg/L
                                       厚壁菌门 Firmicutes
                                      梭杆菌门 Fusobacteria


                                    Candidatus Saccharibacteria
                                    放线菌门 Actinobacteria

                                                         0    20   40    60    80
                                                         肠道微生物各门的相对丰度/%
                                                 relative abundances of gut microbiota at phylum level
                                   图 2    溴氰菊酯暴露后中华绒螯蟹肠道微生物门水平的分类组成
              “*” 表示实验组与对照组相比差异显著       (P<0.05),“**” 表示差异极显著  (P<0.01),下同。
                         Fig. 2 Phylum-level composition of gut microbiotain in E. sinensis exposed to deltamethrin
              “*”  represents  a  significant  difference  (P<0.05)  between  the  test  group  and  the  control  group,  “**”  represents  a  extremely  significant  difference
              (P<0.01), the same below.

              中国水产学会主办  sponsored by China Society of Fisheries                          https://www.china-fishery.cn
                                                            5
   50   51   52   53   54   55   56   57   58   59   60