


Page 127 - 《高原气象》2026年第3期
P. 127
3 期                  姜旭涛等:1961 -2021年中国西北干旱区降水时间均匀性的时空演变特征                                 735


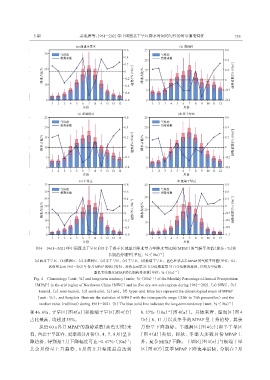
                 图4 1961 -2021年中国西北干旱区和5个干湿子区域逐月降水量占年降水量比例(MPAP)的气候平均值(单位: %)和
                                                  长期趋势增率[单位: %·(10a)]
                                                                          -1
                (a)西北干旱区, (b)湿润区, (c)半湿润区, (d)半干旱区, (e)干旱区, (f)极端干旱区。蓝色柱状表示MPAP的气候平均值(单位: %),
                       盒须图表示1961 -2021年各月MPAP的统计特征, 盒体表示第25百分位数至第75百分位数的范围, 红线为中位数,
                                                                                -1
                                            蓝色实线表示MPAP的长期趋势系数[单位: %·(10a) ]
                Fig. 4 Climatology (unit: %) and long-term tendency [units: %·(10a)⁻¹] of the Monthly Percentage of Annual Precipitation
                (MPAP) in the arid region of Northwest China (NWC) and its five dry-wet sub-regions during 1961 -2021.(a) NWC, (b)
                   Humid, (c) semi-humid, (d) semi-arid, (e) arid, (f) hyper-arid. Blue bars represent the climatological mean of MPAP
                 (unit: %), and boxplots illustrate the statistics of MPAP with the interquartile range (25th to 75th percentiles) and the
                                                                                                         -1
                   median value (red lines) during 1961 -2021.(b) The blue solid line indicates the long-term tendency [unit: %·(10a)]
                                                                             -1
               和 46. 6%, 干旱区[图 4(e)]和极端干旱区[图 4(f)]               0. 37%·(10a)[图 4(a)]。具体来看, 湿润区[图 4
               占比最高, 均超过55%。                                    (b)] 8、 11 月以及冬季的 MPAP 呈上升趋势, 其余
                   从近 60 a各月 MPAP的趋势系数(蓝色实线)来                    月份呈下降趋势。半湿润区[图 4(c)]和半干旱区
               看, 西北干旱区春、 夏季部分月份(3、 4、 7、 8月)呈下                 [图 4(d)]类似, 即秋、 冬季大多数月份 MPAP 上
               降趋势, 特别是 7月下降幅度可达-0. 67%·(10a) ;                  升, 夏季 MPAP 下降。干旱区[图 4(e)]与极端干旱
                                                           -1
               其余月份呈上升趋势, 6 月的上升幅度最高达到                           区[图 4(f)]夏季 MPAP 下降速率最快, 分别在 7 月

