


Page 126 - 《高原气象》2026年第3期
P. 126
高     原      气     象                                 45 卷
              734
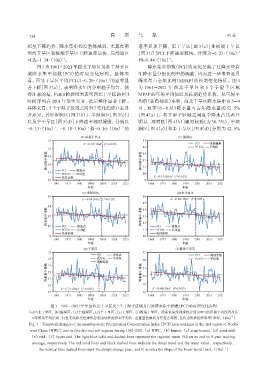
             积呈下降趋势, 降水集中程度整体减弱, 尤其在南                           速率显著下降, 而干旱区[图 3(e)]和极端干旱区
             部的干旱区和极端干旱区下降速率最快, 局部地区                           [图 3(f)]PCI 下降速率较快, 分别为-0. 23·(10a)           -1
                             -1
             可达-1. 34·(10a) 。                                   和-0. 44·(10a) 。
                                                                             -1
                  图 3为 1961 -2021年西北干旱区及各干湿子区                       降水集中指数(PCI)的变化反映了月降水量在
             域降水集中指数(PCI)的时间变化序列。整体来                            年降水量分配比例中的调整, 因而进一步考查逐月
             看, 西北干旱区平均 PCI以-0. 29·(10a) 的速率显                   降水量占全年比例(MPAP)的长期变化特征。图 4
                                                  -1
             著下降[图 3(a)], 表明降水年内分布趋于均匀。值                        为 1961 -2021 年 西 北 干 旱 区 和 5 个 干 湿 子 区 域
             得注意的是, Pettitt检验结果表明西北干旱区的PCI                      MPAP的气候平均值以及长期趋势系数。从气候平
             时间序列在 2001 年发生突变, 此后整体显著下降。                        均值(蓝色柱状)来看, 西北干旱区降水集中在 5 -9
             具体来看, 5个干湿子区域之间PCI变化趋势存在显                          月, 夏季(6 -8 月)降水量可占年降水量的 52. 5%
             著差异, 其中湿润区[图 3(b)]、 半湿润区[图 3(c)]                  [图 4(a)]。各干湿子区域之间夏季降水占比差异
             以及半干旱区[图 3(d)]下降速率相对缓慢, 分别以                        明显, 湿润区[图 4(b)]相对较低(为 38. 3%), 半湿
             -0. 13·(10a) 、 -0. 18·(10a) 和-0. 16·(10a) 的        润区[图 4(c)]和半干旱区[图 4(d)]分别为 42. 5%
                                                        -1
                                        -1
                         -1


                        图3 1961 -2021年中国西北干旱区及5个干湿子区域月尺度降水集中指数(PCI)的时间变化序列
              (a)西北干旱区, (b)湿润区, (c)半湿润区, (d)半干旱区, (e)干旱区, (f)极端干旱区。浅蓝色实线和虚线分别为PCI的区域平均序列及其
                                                                                                          -1
                9年滑动平均序列, 红色实线和黑色虚线分别为线性趋势和平均值, 垂直蓝色虚线为突变点年份, K值为线性趋势斜率[单位: (10a) ]
              Fig. 3 Temporal changes of the monthly-scale Precipitation Concentration Index (PCI) area-averaged in the arid region of North‐
               west China (NWC) and its five dry-wet sub-regions during 1961-2021.(a) NWC, (b) humid, (c) semi-humid, (d) semi-arid,
               (e) arid, (f) hyper-arid. The light blue solid and dashed lines represent the regional mean PCI series and its 9-year moving
                average, respectively. The red solid lines and black dashed lines indicate the linear trend and the mean value, respectively,
                                                                                                      -1
                   the vertical blue dashed lines mark the abrupt change year, and K denotes the slope of the linear trend [unit: (10a)]

