


Page 130 - 《高原气象》2026年第3期
P. 130
高     原      气     象                                 45 卷
              738


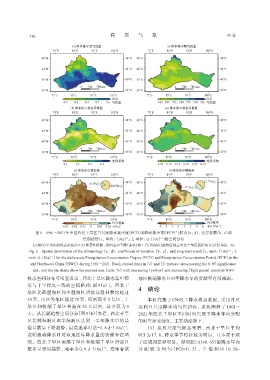
                 图6 1961 -2021年中国西北干旱区日尺度降水集中度(PCD)和降水集中期(PCP)气候态(a, d)、 变异系数(b, e)和
                                                          -1
                                                                          -1
                                       长期趋势[c, 单位: (10a) ; f, 单位: d·(10a)]的空间分布
               (c)和(f)中黑色斜线表示通过0. 05显著性检验, 饼图表示下降(黄色)和上升(浅绿色)趋势区域占西北干旱区面积的百分比(单位: %)
              Fig. 6 Spatial distribution of the climatology (a, d), coefficient of variation (b, e), and long-term trend [c, unit: (10a)⁻¹; f,
              unit: d·(10a)⁻¹] for the daily-scale Precipitation Concentration Degree (PCD) and Precipitation Concentration Period (PCP) in the
               arid Northwest China (NWC) during 1961 -2021. Black slanted lines in (c) and (f) indicate areas passing the 0. 05 significance
                test, and the pie charts show the percent area (unit: %) with decreasing (yellow) and increasing (light green) trends in NWC
             候态空间分布可明显看出, 西北干旱区降水集中程                            地区极端降水日对年降水量的贡献率有所减弱。
             度与干旱程度一致的空间格局[图 9(a)]。西北干
             旱区北部湿润区和半湿润区所需最湿日数均超过                              4  结论
             35 天, 山区等地区超过 70 天, 而南部半干旱区、 干                         本研究基于 CN05. 1 降水格点数据, 采用月尺
             旱区和极端干旱区普遍在 25 天以内, 最少仅为 5                         度和日尺度降水均匀性指标, 系统阐释了 1961 -
             天。从长期趋势空间分布[图 9(b)]来看, 西北干旱                        2021 年西北干旱区不同时间尺度下降水年内分配
             区北部湿润区和半湿润区达到一半年降水量的最                              的时空演变特征, 主要结论如下:
                                                         -1
             湿日数呈下降趋势, 最高速率可达-1. 8 d·(10a) ,                       (1)  从月尺度气候态来看, 西北干旱区平均
             表明极端降水日对该地区年降水量的贡献率在增                              PCI 为 17. 8, 降水季节特征较为明显, 且不同干湿
             强。西北干旱区南部干旱区和极端干旱区所需日                              子区域间差异明显。湿润区(AI≥0. 65)的降水年内
                                                -1
             数多呈增加趋势, 速率为 0. 9 d·(10a) , 意味着该                   分 配 较 为 均 匀(PCI=11. 3),  半 湿 润 区[0. 50~

