


Page 132 - 《高原气象》2026年第3期
P. 132
高     原      气     象                                 45 卷
              740


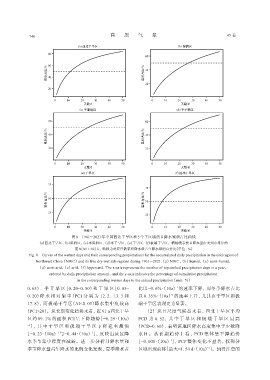
                                 图8 1961 -2021年中国西北干旱区和5个子区域的日降水累积占比曲线
                  (a)西北干旱区, (b)湿润区, (c)半湿润区, (d)半干旱区, (e)干旱区, (f)极端干旱区。横轴表示按日降水量由大到小排序的
                                   前N(N=1~50)天, 纵轴为对应日数累积降水量占年降水量的百分比(单位: %)
              Fig. 8 Curves of the wettest days and their corresponding proportations for the accumulated daily precipitation in the arid region of
                 Northwest China (NWC) and its five dry-wet sub-regions during 1961 -2021.(a) NWC, (b) humid, (c) semi-humid,
                  (d) semi-arid, (e) arid, (f) hyper-arid. The x-axis represents the number of top-ranked precipitation days in a year,
                       ordered by daily precipitation amount, and the y-axis indicates the percentage of cumulative precipitation
                                    in the corresponding wettest days to the annual precipitation (unit: %)
             0. 65)、  半 干 旱 区[0. 20~0. 50)和 干 旱 区[0. 05~        比以-0. 6%·(10a) 的速率下降, 而冬季降水占比
                                                                                 -1
                                                                               -1
             0. 20)降 水 相 对 集 中(PCI 分 别 为 12. 2、  13. 3 和        以 0. 35%·(10a) 的速率上升, 尤其在干旱区和极
             17. 8), 而极端干旱区(AI<0. 05)降水集中度较高                    端干旱区表现更为显著。
             (PCI>20)。从长期变化趋势来看, 近 61 a西北干旱                        (2)  从日尺度气候态来看, 西北干旱区平均
             区约 89. 1% 的面积 PCI 呈下降趋势[-0. 29·(10a)               PCD 为 0. 52,  其 中 干 旱 区 和 极 端 干 旱 区 最 高

             -1 ],  其 中 干 旱 区 和 极 端 干 旱 区 下 降 速 率 最 快          (PCD≈0. 60), 表明该地区降水高度集中于少数降
                                          -1
                           -1
             [-0. 23·(10a) 与-0. 44·(10a) ], 反映出该区降              水日。从长期趋势上看, PCD 整体呈下降趋势
             水季节集中程度在减弱。进一步分析月降水量和                             [-0. 008·(10a)], PCP 整体变化不显著, 仅部分
                                                                              -1
                                                                                               -1
             季节降水量占年降水的比例变化发现, 夏季降水占                            区域出现前移[最大-1. 54 d·(10a)]。值得注意的

