


Page 124 - 《高原气象》2026年第3期
P. 124
高     原      气     象                                 45 卷
              732


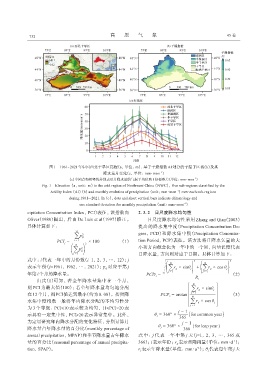
                       图1 1961 -2021年中国西北干旱区高程(a, 单位: m)、 基于干燥指数AI划分的干湿子区域(b)及其
                                                降水量月变化(c, 单位: mm·mon )
                                                                          -1
                                                                                         -1
                                (c)中圆点和短竖线分别表示月降水量的气候平均值和1倍标准差(单位: mm·mon )
                    Fig. 1 Elevation (a, unit: m) in the arid region of Northwest China (NWC), five sub-regions classified by the
                        Aridity Index (AI) (b) and monthly evolution of precipitation (unit: mm·mon ) over each sub-regions
                                                                                 -1
                                during 1961 -2021. In (c), dots and short vertical bars indicate climatology and
                                     one standard deviation for monthly precipitation (unit: mm·mon )
                                                                                    -1
             cipitation Concentration Index, PCI)表征, 该指数由       2. 3. 2 日尺度降水均匀性
             Oliver(1980)提出, 后由 De Luis et al(1997)修正。              日尺度降水均匀性采用 Zhang and Qian(2003)
             具体计算如下:                                            提出的降水集中度(Precipitation Concentration De‐
                                   12
                                      2                         gree, PCD)和降水集中期(Precipitation Concentra‐
                                  ∑ p ij
                                 ( )                            小和方向概念化为一年中的一个圆, 向量长度代表
                           PCI j =  i = 1  2  × 100     (1)     tion Period, PCP)表征。该方法将日降水矢量的大
                                   12
                                      2
                                  ∑ p ij
                                  i = 1
             式中: i 代表一年中的月份数(i=1, 2, 3, …, 12); j               日降水量, 方向则对应于日期。具体计算如下:
                                                                                                         2
                                                                                         2
                                                                              N               N         )
             表示年份(j=1961, 1962, …, 2021); p ij 对应于第 j
                                                                             ∑ r ij × sinθ j  + ∑ r ij × cos θ j
             年第i个月的降水量。                                            PCD i =  ( j = 1     ) ( j = 1         (2)
                                                                                          R i
                  由式(1)可知, 若全年降水量集中在一个月,
                                                                                        N
             则 PCI 为最大值(100); 若全年降水量均匀地分配                                             æ ç ç ç  ∑ r ij × sinθ j  ö ÷ ÷ ÷ ÷
             在12个月, 则PCI值达到最小(约为0. 08)。按照降                                PCP i = arctan ç ç ç j = 1  ÷ ÷ ÷ ÷  (3)
                                                                                      ç
                                                                                        N
             水集中度指数一般将年内降水分配的不均匀性分                                                    ç ç ç∑ r ij × cos θ j ÷ ÷ ÷ ÷
                                                                                      ç ç
             为 3 个等级: PCI≤10 表示较为均匀, 11≤PCI<20 表                                  j - 1 è  j = 1   ø
             示具有一定集中性, PCI≥20 表示异常集中。此外,                               θ j = 360° ×    ( for common year)
                                                                                  365
             为定量研究年内降水分配的变化特征, 分别计算月                                                j - 1
                                                                         θ j = 360° ×    (for leap year )
             降水量占年降水量的百分比(monthly percentage of                                     366
             annual precipitation, MPAP)和季节降水量占年降水              式中: j 代表一年中第 j 天(j=1, 2, 3, …, 365 或
                                                                                                           -1
             量的百分比(seasonal percentage of annual precipita‐     366); i表示年份; r ij 表示日降雨量(单位: mm·d );
             tion, SPAP)。                                       r i 表示年降水量(单位: mm·a ); θ j 代表每年第 j 天
                                                                                          -1

