
Page 289 - 《高原气象》2026年第1期
P. 289
1 期 伏 晶等:多个高时空分辨率降水数据在西北地区东部“7·22”特大暴雨事件中的精度评估 285
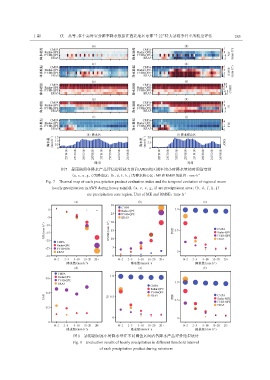
图7 暴雨期间各降水产品评估指标热力图和AWS的区域平均小时降水量的时间演变图
(a、 c、 e、 g、 i)为降水区; (b、 d、 f、 h、 j)为降水核心区; ME和RMSE的单位: mm·h -1
Fig. 7 Thermal map of each precipitation product evaluation index and the temporal evolution of regional mean
hourly precipitation in AWS during heavy rainfall.(a, c, e, g, i) are precipitation area; (b, d, f, h, j)
are precipitation core region. Unit of ME and RMSE: mm·h -1
图8 暴雨期间逐小时降水量在不同阈值区间内各降水产品评价结果统计
Fig. 8 Evaluation results of hourly precipitation in different threshold interval
of each precipitation product during rainstorm