
Page 98 - 《高原气象》2025年第5期
P. 98
高 原 气 象 44 卷
1216
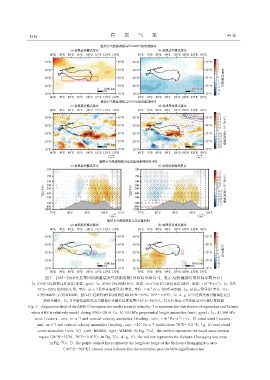
图7 1985 -2014年夏季回归到整层大气热源指数(回归结果乘以-1, 表示AHS偏弱时的回归系数分布)
-1
-1
-2
(a, b)500 hPa位势高度异常(单位: gpm), (c, d)500 hPa风场(矢量, 单位: m·s )及垂直速度异常(填色, 单位: ×10 Pa·s ), (e, f)沿
-1
-1
-2
70°E -110°E纬向风(矢量, 单位: m·s )及垂直速度异常(填色, 单位: ×10 Pa·s )的垂直剖面, (g, h)总云量异常(单位: %);
左列BMME; 右列WMME。图(a)中红框代表纬向剖面区域(26°N -32°N, 70°E -110°E), (c, d, g, h)中红框代表川渝地区复合
热浪关键区, (e, f)中紫色虚线代表川渝地区关键区经度范围(105°E -108°E)。打点区域表示异常超过90%置信度检验
Fig. 7 Regression field of the AHSI (The regression results are multiplied by -1 to represent the distribution of regression coefficients
when AHS is relatively weak) during 1985 -2014.(a, b) 500 hPa geopotential height anomalies (unit: gpm); (c, d) 500 hPa
-1
wind (vectors, unit: m·s ) and vertical velocity anomalies (shading, unit: ×10 Pa·s ); (e, f) zonal wind (vectors,
-1
-2
-1
-1
unit: m·s ) and vertical velocity anomalies (shading, unit: ×10 Pa·s ) profile from 70°E -110 °E; (g, h) total cloud
-2
cover anomalies (unit: %), Left: BMME; right: WMME. In Fig. 7(a), the red box represents the zonal cross-section
region (26°N -32°N, 70°E -110°E); in Fig. 7(c, d, g, h), the red box represents the Sichuan-Chongqing key area;
in Fig. 7(e, f), the purple dashed lines represent the longitude range of the Sichuan-Chongqing key area
(105°E -108°E). Dotted areas indicate that the anomalies pass the 90% significance test