
Page 84 - 《高原气象》2025年第5期
P. 84
高 原 气 象 44 卷
1202
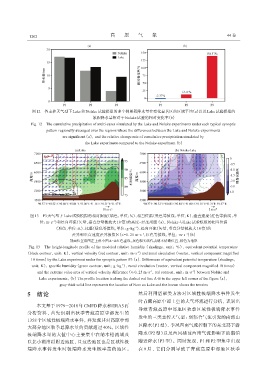
图12 各主控天气型下Lake和Nolake试验模拟的多个例累积降水量在变化显著区的区域平均(a)以及Lake试验模拟的
累积降水量相对于Nolake试验的相对变化率(b)
Fig. 12 The cumulative precipitation of multi-cases simulated by the Lake and Nolake experiments under each typical synoptic
pattern regionally averaged over the regions where the differences between the Lake and Nolake experiments
are significant (a), and the relative change rate of cumulative precipitation simulated by
the Lake experiment compared to the Nolake experiment (b)
图13 P3天气型下Lake试验模拟的相对湿度(填色,单位:%)、相当位温(黑色等值线,单位:K)、垂直速度(红色等值线,单
位:m·s )和经向环流(矢量,垂直分量被放大10倍)的高度-经度剖面 (a), Nolake与Lake试验模拟的相当位温
-1
-1
(填色,单位:K)、比湿(绿色等值线,单位:g·kg )、经向环流(矢量,垂直分量被放大10倍)的
-1
-1
差异和垂直速度差异极值区(≤-0. 25 m·s ,红色等值线,单位: m·s )(b)
剖面位置沿图左上角小图A-B红色虚线,灰色粗实线代表纳木错湖位置,棕色为地形
Fig. 13 The height-longitude profile of the modeled relative humidity (shadings, unit: %), equivalent potential temperature
(black contour, unit: K), vertical velocity (red contour, unit: m·s ) and zonal circulation (vector, vertical component magnified
-1
10 times) by the Lake experiment under the synoptic pattern P3 (a). Differences of equivalent potential temperature (shadings,
unit: K), specific humidity (green contour, unit: g·kg ), zonal circulation (vector, vertical component magnified 10 times)
-1
-1
-1
and the extreme value area of vertical velocity difference (≤-0. 25 m·s , red contour, unit: m·s ) between Nolake and
Lake experiments, (b) The profile location is along the dashed red line A-B in the upper left corner of the figure (a),
gray thick solid line represents the location of Nam co Lake and the brown shows the terrains
5 结论 然后利用谱聚类方法对区域性极端降水事件发生
时青藏高原中部上空的大气环流进行分析, 识别出
本文基于 1979 -2018年 CMFD降水和 ERA5再
导致青藏高原中部地区秋季区域性极端降水事件
分析资料, 首先识别出秋季青藏高原中部发生的
发生的三类主控天气型: 弱辐合气流引发的南部山
1358个区域性极端降水事件, 并发现其对高原中部
区降水(P1型)、 季风西南气流控制下的东北部下游
大部分地区秋季总降水量的贡献超过 40%, 区域性
极端降水量的大值中心主要集中在纳木错流域及 降水(P2 型)以及西风槽前西南气流影响下的湖泊
以北小湖泊群附近地区, 且这些地区也是区域性极 附近降水(P3 型)。同时发现, P1 和 P2 型集中出现
端降水事件发生时极端降水发生概率高的地区。 在 9 月, 它们分别导致了青藏高原中部地区秋季