
Page 38 - 《高原气象》2022年第5期
P. 38
5 期 李双双等:中亚地区冬季极端降雪增加与北大西洋两类海温模态增强的联系 1131
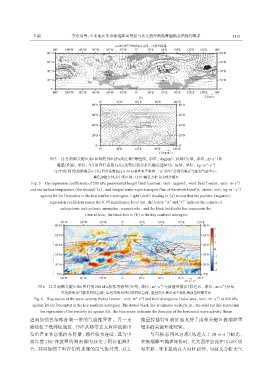
图5 12月南部关键区R6回归的500 hPa高度场(等值线,单位:dagpm)、风场(矢量,单位:m·s )和
-1
-1
-1
海温(阴影,单位:℃)的回归系数(a)以及整层积分水汽输送通量(b,矢量,单位:kg·m ·s )
(a)中浅(深)色阴影表示正(负)回归系数通过0. 05显著性水平检验,“A”和“C”分别代表反气旋和气旋中心,
黑色加粗实线为中亚区域;(b)中黑色方框为南部关键区
-1
Fig. 5 The regression coefficients of 500 hPa geopotential height field(contour,unit:dagpm),wind field(vector,unit:m·s )
-1
-1
and sea surface temperature(the shaded)(a),and integral water vapor transport flux of the whole layer(b,vector,unit:kg·m ·s )
against R6 for December in the key southern subregion. Light(dark)shading in(a)means that the positive(negative)
regression coefficient passes the 0. 05 significance level test,the letters“A”and“C”indicate the centers of
anticyclonic and cyclonic anomalies,respectively,and the black bold solid line represents the
Central Asia;the black box in(b)is the key southern subregion
-2
2
-2
图6 12月南部关键区R6回归的200 hPa波作用通量(矢量,单位:m·s )与波通量散度(彩色区,单位:m·s )分布
黑色虚线为气候态西风急流,红色实线为回归的西风急流,蓝色箭头表示水平波作用通量传播方向
2
-2
Fig. 6 Regression of the wave activity fluxes(vector,unit:m·s )and their divergence(color area,unit:m·s )at 200 hPa
-2
against R6 for December in the key southern subregion. The dotted black line is climatic westerly jet,the solid red line represents
the regression of the westerly jet against R6,the blue arrow indicates the direction of the horizontal wave activity fluxes
进而加强巴尔喀什湖一带的气旋性异常。另一支 能量传播特征较好地支持了南部关键区极端降雪
路径位于低纬度地区,TNF从热带北大西洋波源出 增多的关键环流配置。
-1
发沿着亚非急流向东传播,路径较为连续,其与中 与气候态西风急流(风速大于 20 m·s )相比,
高纬度 TNF 在波罗的海南部的分支于阿拉伯海汇 在极端降雪偏多年份时,北大西洋急流在出口区明
合,共同加强了阿拉伯海北部的反气旋异常,以上 显东移,亚非急流在入口区西伸,与前文分析大气