
Page 67 - 《高原气象》2021年第5期
P. 67
高 原 气 象 40 卷
1028
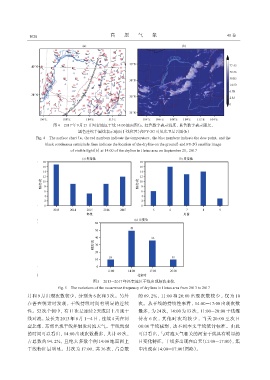
图4 2017年9月21日河套地区干线14:00地面图(a,红色数字表示温度,蓝色数字表示露点,
黑色连续半圆线表示地面干线位置)和FY-2G可见光卫星云图(b)
Fig. 4 The surface chart(a,the red numbers indicate the temperature,the blue numbers indicate the dew point,and the
black continuous semicircle lines indicate the location of the dryline on the ground)and FY-2G satellite image
of visible light(b)at 14:00 of the dryline in Hetao area on September 21,2017
图5 2013-2017年河套地区干线出现频次变化
Fig. 5 The variations of the occurrence frequency of drylines in Hetao area from 2013 to 2017
月和 9 月出现次数较少,分别为 6 次和 3 次。另外 的 69. 2%,11:00 和 20:00 出现次数较少,仅为 10
在普查统计时发现,干线持续时间有明显的连续 次。从干线的持续性来看,14:00-17:00 出现次数
性。52次个例中,有 11次是连续 2天或以上出现干 最多,为 24 次,14:00 为 13 次,11:00-20:00 干线维
线对流,最长为 2013 年 8 月 1-4 日,连续 4 天在河 持有 6 次,其他时次均较少,当天 20:00 至次日
套北部、东部出现干线并触发对流天气。干线出现 08:00 干线减弱,达不到本文干线统计标准。由此
的时间可以看出,14:00 出现次数最多,共计 49 次, 可以看出,与对流天气相关的河套干线具有明显的
占总数的 94. 2%,且绝大多数个例 14:00 地面图上 日变化特征,干线多出现在白天(11:00-17:00),集
干线特征最明显。其次为 17:00,共 36 次,占总数 中出现在14:00-17:00(图略)。