
Page 74 - 《爆炸与冲击》2025年第6期
P. 74
第 45 卷 张 旭,等: 高温大理岩的动态能量耗散机理及破坏特征 第 6 期
Stabilise 250 Stabilise
160
Increase 200 Increase Incident
120
Energy/J 80 Energy/J 150 Transmitted
Reflectance
Decline 100 Decline Absorbed
40 50 25 100 200 400 600 800
Decline Decline Temperature/℃
0 0
0 50 100 150 200 250 0 50 100 150 200 250
t/µs t/µs
(d) v=13.5 m/s (e) v=14.5 m/s
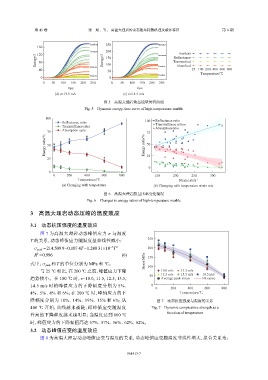
图 5 高温大理岩动态能量时程曲线
Fig. 5 Dynamic energy-time curve of high-temperature marble
100
Reflectance ratio 100 Reflectance ratio
Transmittance ratio Transmittance ratio
Absorption ratio
75 Absorption ratio 75
Energy ratio/% 50 Energy ratio/% 50
25 25
0
0
0 200 400 600 800 150 200 250 300
Temperature/℃ Strain rate/s −1
(a) Changing with temperature (b) Changing with temperature strain rate
图 6 高温大理岩能量比率变化情况
Fig. 6 Changes in energy ratios of high-temperature marble
3 高温大理岩动态压缩的温度效应
3.1 动态抗压强度的温度效应
图 7 为高温大理岩动态峰值应力 σ 与温度
250
T 的关系,动态峰值应力随温度呈非线性减小:
−4
σ peak =214.509 9−0.107 4T−1.280 31×10 T 2 200
2
R =0.996 (6) 150
T 的单位分别为 MPa 和 ℃。 Stress/MPa
式中: σ peak 和 100
与 25 ℃ 相比,在 200 ℃ 之前,峰值应力下降 10.0 m/s 11.5 m/s
50 12.5 m/s 13.5 m/s 14.5 m/s
趋势较小。在 100 ℃ 时,v=10.0, 11.5, 12.5, 13.5, Average peak stress Fit curve
14.5 m/s 时的峰值应力的下降幅度分别为 5%、 0
0 200 400 600 800
4%、5%、4% 和 6%;在 200 ℃ 时,峰值应力的下 Temperature/℃
降幅度分别为 18%、14%、19%、15% 和 6%;从 图 7 动态抗压强度与温度的关系
400 ℃ 开始,曲线越来越陡,即峰值应变随温度 Fig. 7 Dynamic compressive strength as a
升高的下降程度越来越明显;当温度达到 800 ℃ function of temperature
时,峰值应力的下降幅值高达 57%、57%、56%、62%、62%。
3.2 动态峰值应变的温度效应
图 8 为高温大理岩动态峰值应变与温度的关系,动态峰值应变随温度非线性增大,拟合关系为:
061413-7