Page 156 - 《中国电力》2026年第3期
P. 156

2026  年 第 59 卷


              时间尺度的故障过程主导参数辨识中,重点对有                             成传统方法。分别通过本文策略与传统方法对另
              功控制模式及相关参数进行了辨识。通过明晰黑                             一厂家封装模型进行辨识,将辨识结果代入建立
              盒模型中     DFIG  的结构及其在低电压穿越过程中                     的白盒模型中,在出力             0.9 p.u.和  0.2 p.u.下,设置
              的控制策略,并识别不同时间尺度动态行为中的                             电压跌落至       0.20 p.u.、0.35 p.u.、0.50 p.u.、0.75 p.u.
              主导参数,最终实现对黑盒模型的全面辨识。                              和  0.90 p.u.故障,以电压跌落至         0.2 p.u.的最严重故

              3.3    与传统方法对比验证                                  障为例,与厂家黑盒封装模型的故障响应暂态特
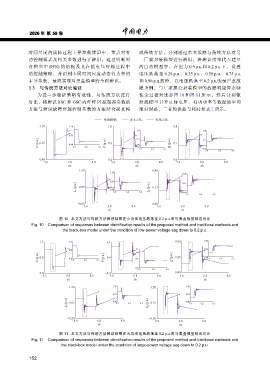
                  为进一步验证策略有效性,与传统方法进行                           性全过程对比如图           10  和图  11  所示。然后分别依
              对比,将辨识       RSC  和  GSC  内外环  PI 控制器参数的          照规程    [32]  计算正序电压、有功功率等数据的平均
              方法与辨识故障穿越控制参数的方法结合起来构                             绝对误差,二者的误差与耗时如表                  7  所示。

                                                黑盒模型;       本文方法;       传统方法

                   1.10         1.10              1.0                           0.8
                                                               1.0                           0.8
                                0.75                           0.3
                  U (p.u.)  0.75  0.40           P (p.u.)  0.3                Q (p.u.)  0.1  0.1
                                              6.5
                                       6.2
                                                              −0.4
                                  5.9
                                                                5.9   6.2  6.5               −0.6
                                                                                              5.9   6.2   6.5
                   0.40                          −0.4                          −0.6
                     5.6        6.8        8.0      5.6       6.8        8.0     5.6        6.8        8.0
                                t/s                            t/s                          t/s
                                     1.10                             0.90
                                                   1.10
                                                                                    0.90
                                                   0.25                             0.15
                                   I P  (p.u.)  0.25  −0.60          I Q  (p.u.)  0.15
                                                          6.2
                                                                6.5
                                                    5.9
                                                                                   −0.60
                                                                                     5.9   6.2    6.5
                                    −0.60                            −0.60
                                       5.6        6.8        8.0        5.6        6.8        8.0
                                                  t/s                              t/s
                            图 10   本文方法与传统方法辨识结果在小功率电压跌落至                0.2 p.u.时与黑盒模型响应对比
               Fig. 10    Comparison of responses between identification results of the proposed method and traditional methods and
                             the black-box model under the condition of low-power voltage sag down to 0.2 p.u.


                   1.2          1.2              1.1                            0.90          0.90
                                                              1.1                             0.25
                                0.8
                  U (p.u.)  0.8  0.4 5.9  6.2  6.5  P (p.u.)  0.4  0.4         Q (p.u.)  0.25  −0.40 5.9  6.2  6.5

                                                              −0.3
                                                               5.9    6.2   6.5
                   0.4                           −0.3                           −0.40
                    5.6        6.8        8.0      5.6        6.8       8.0        5.6       6.8        8.0
                               t/s                            t/s                            t/s
                                1.50                1.50             1.20            1.20
                                                    0.65                             0.35
                               I P  (p.u.)  0.65    −0.20 5.9  6.2  6.5  I Q  (p.u.)  0.35  −0.50 5.9  6.2  6.5


                                −0.20                                −0.50
                                  5.6        6.8        8.0            5.6        6.8        8.0
                                             t/s                                  t/s
                            图 11   本文方法与传统方法辨识结果在大功率电压跌落至                0.2 p.u.时与黑盒模型响应对比
               Fig. 11    Comparison of responses between identification results of the proposed method and traditional methods and
                             the black-box model under the condition of large-power voltage sag down to 0.2 p.u.

              152
   151   152   153   154   155   156   157   158   159   160   161