
Page 20 - 《渔业研究》2026年第1期
P. 20
第 1 期 李 娴等: 乌鳢生长性状全基因组关联分析 17
−4
小于 1×10 的 SNP 位点,对这 6 个位点上下游 其进行功能注释,共注释到 17 个与乌鳢体全长性
50 kb 区域进行扫描,寻找潜在候选关联基因并对 状相关的潜在功能基因(表 3) 。
8
6
负对数P值 −log 10 (P) 4
2
0
1 2 3 4 5 6 7 8 9 10 11 12 13 14 15 16 17 18 19 20 21222324
染色体 Chromosomes
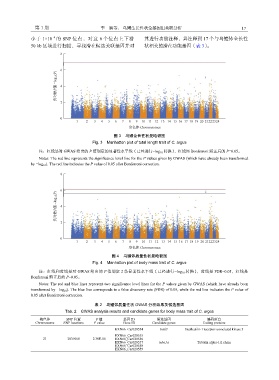
图 3 乌鳢全长性状曼哈顿图
Fig. 3 Manhatton plot of total length trait of C. argus
注:红线是对 GWAS 给出的 P 值划定的显著性水平线(已经进行−log 1 转换) ,红线经 Bonferroni 矫正后的 P=0.05。
0
Notes: The red line represents the significance level line for the P values given by GWAS (which have already been transformed
by −log 10 ). The red line indicates the P value of 0.05 after Bonferroni correction.
8
6
负对数P值 −log 10 (P) 4
2
0
1 2 3 4 5 6 7 8 9 10 11 12 13 14 15 16 17 18 19 20 21222324
染色体 Chromosomes
图 4 乌鳢体质量性状曼哈顿图
Fig. 4 Manhatton plot of body mass trait of C. argus
注:红线和蓝线是对 GWAS 给出的 P 值划定 2 条显著性水平线(已经进行−log 1 转换) ,蓝线是 FDR=0.05,红线是
0
Bonferroni 矫正后的 P=0.05。
Notes: The red and blue lines represent two significance level lines for the P values given by GWAS (which have already been
transformed by −log 10 ). The blue line corresponds to a false discovery rate (FDR) of 0.05, while the red line indicates the P value of
0.05 after Bonferroni correction.
表 2 乌鳢体质量性状 GWAS 分析结果及候选基因
Tab. 2 GWAS analysis results and candidate genes for body mass trait of C. argus
染色体 SNP 位置 P 值 基因 ID 候选基因 编码蛋白
Chromosome SNP locations P value Gene ID Candidate genes Coding proteins
EXN66_Car020554 irak3 Interleukin-1 receptor-associated kinase 3
EXN66_Car020555
21 2831060 2.30E-06 EXN66_Car020556
EXN66_Car020557 tuba1a Tubulin alpha-1A chain
EXN66_Car020558
EXN66_Car020559