
Page 85 - 《运动与健康科学》(英文)2024年第2期
P. 85
TaggedAPTARAEndAssociation of PA with risk of chronic kidney disease in China 207
Table 1
TaggedAPTARACaptionCharacteristics of study participants by baseline total physical activity. TaggedAPTARAEnd
CharacteristicsTaggedAPTARAEnd Baseline total physical activity (MET-h/day)TaggedAPTARAEnd p trend TaggedAPTARAEndTaggedAPTARAEnd
Q1TaggedAPTARAEnd Q2TaggedAPTARAEnd Q3TaggedAPTARAEnd Q4TaggedAPTARAEnd TaggedAPTARAEndTaggedAPTARAEndTaggedAPTARATbody
Participant (n)TaggedAPTARAEnd 118,889TaggedAPTARAEnd 118,895TaggedAPTARAEnd 118,812TaggedAPTARAEnd 118,780TaggedAPTARAEnd TaggedAPTARAEnd
Mean age (year)TaggedAPTARAEnd 57.13TaggedAPTARAEnd 52.42TaggedAPTARAEnd 49.15TaggedAPTARAEnd 47.16TaggedAPTARAEnd <0.001TaggedAPTARAEndTaggedAPTARAEnd
Women (%)TaggedAPTARAEnd 59.25TaggedAPTARAEnd 65.94TaggedAPTARAEnd 60.43TaggedAPTARAEnd 51.88TaggedAPTARAEnd <0.001TaggedAPTARAEndTaggedAPTARAEnd
Urban residents (%)TaggedAPTARAEnd 51.43TaggedAPTARAEnd 49.01TaggedAPTARAEnd 37.74TaggedAPTARAEnd 34.28TaggedAPTARAEnd <0.001TaggedAPTARAEndTaggedAPTARAEnd
Middle school and above (%)TaggedAPTARAEnd 49.70TaggedAPTARAEnd 50.98TaggedAPTARAEnd 49.52TaggedAPTARAEnd 46.51TaggedAPTARAEnd <0.001TaggedAPTARAEndTaggedAPTARAEnd
Annual household income >RMB19,999 (%)TaggedAPTARAEnd 39.88TaggedAPTARAEnd 46.13TaggedAPTARAEnd 44.28TaggedAPTARAEnd 41.83TaggedAPTARAEnd 0.652TaggedAPTARAEndTaggedAPTARAEnd
Agricultural and industrial workers (%)TaggedAPTARAEnd 30.88TaggedAPTARAEnd 51.32TaggedAPTARAEnd 69.97TaggedAPTARAEnd 76.04TaggedAPTARAEnd <0.001TaggedAPTARAEndTaggedAPTARAEnd
Married (%)TaggedAPTARAEnd 90.32TaggedAPTARAEnd 91.20TaggedAPTARAEnd 91.27TaggedAPTARAEnd 91.24TaggedAPTARAEnd <0.001TaggedAPTARAEndTaggedAPTARAEnd
Current daily smokers (%)TaggedAPTARAEnd 28.69TaggedAPTARAEnd 28.79TaggedAPTARAEnd 29.18TaggedAPTARAEnd 29.76TaggedAPTARAEnd <0.001TaggedAPTARAEndTaggedAPTARAEnd
Current weekly drinkers (%)TaggedAPTARAEnd 13.70TaggedAPTARAEnd 15.41TaggedAPTARAEnd 15.66TaggedAPTARAEnd 15.40TaggedAPTARAEnd <0.001TaggedAPTARAEndTaggedAPTARAEnd
a
Regular consumption of foods (%) TaggedAPTARAEnd TaggedAPTARAEnd
MeatTaggedAPTARAEnd 47.75TaggedAPTARAEnd 48.02TaggedAPTARAEnd 45.71TaggedAPTARAEnd 47.46TaggedAPTARAEnd 0.011TaggedAPTARAEndTaggedAPTARAEnd
Fresh vegetablesTaggedAPTARAEnd 98.27TaggedAPTARAEnd 98.75TaggedAPTARAEnd 97.62TaggedAPTARAEnd 98.63TaggedAPTARAEnd <0.001TaggedAPTARAEndTaggedAPTARAEnd
Fresh fruitsTaggedAPTARAEnd 29.00TaggedAPTARAEnd 30.18TaggedAPTARAEnd 26.34TaggedAPTARAEnd 25.12TaggedAPTARAEnd <0.001TaggedAPTARAEndTaggedAPTARAEnd
Sedentary leisure time (h/day)TaggedAPTARAEnd 3.49TaggedAPTARAEnd 3.17TaggedAPTARAEnd 2.71TaggedAPTARAEnd 2.59TaggedAPTARAEnd <0.001TaggedAPTARAEndTaggedAPTARAEnd
2
BMI (kg/m )TaggedAPTARAEnd 23.83TaggedAPTARAEnd 23.74TaggedAPTARAEnd 23.44TaggedAPTARAEnd 23.36TaggedAPTARAEnd <0.001TaggedAPTARAEndTaggedAPTARAEnd
Hypertension (%)TaggedAPTARAEnd 35.09TaggedAPTARAEnd 34.65TaggedAPTARAEnd 32.30TaggedAPTARAEnd 32.21TaggedAPTARAEnd <0.001TaggedAPTARAEndTaggedAPTARAEnd
Diabetes (%)TaggedAPTARAEnd 6.52TaggedAPTARAEnd 5.60TaggedAPTARAEnd 4.42TaggedAPTARAEnd 3.83TaggedAPTARAEnd <0.001TaggedAPTARAEndTaggedAPTARAEndTaggedAPTARAEnd
Notes: The quartiles of total physical activity were Q1: 011.05, Q2: >11.0518.23, Q3: >18.2330.71, Q4: >30.71 MET-h/day, respectively. Values are means
or percentages of participants adjusted for age, sex, and region, where appropriate.TaggedAPTARAEnd
a
Values indicated the consumption frequency as “4 days/week”.
TaggedAPTARAFigureAbbreviations: BMI = body mass index; MET-h/day = metabolic equivalent of task hours per day.TaggedAPTARAEnd
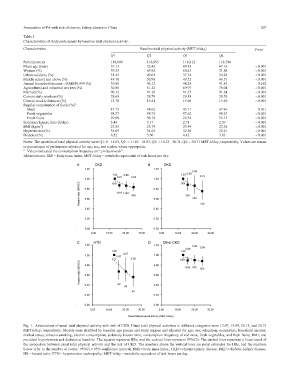
Fig. 1. Associations of usual total physical activity with risk of CKD. Usual total physical activities in different categories were 13.07, 15.89, 20.13, and 24.75
MET-h/day, respectively. Models were stratified by baseline age groups and study regions and adjusted for age; sex; education; occupation; household income;
marital status; tobacco smoking; alcohol consumption; sedentary leisure time; consumption frequency of red meat, fresh vegetables, and fresh fruits; BMI; and
prevalent hypertension and diabetes at baseline. The squares represent HRs, and the vertical lines represent 95%CIs. The dashed lines represent a linear trend of
the association between usual total physical activity and the risk of CKD. The numbers above the vertical lines are point estimates for HRs, and the numbers
below refer to the number of events. 95%CI = 95% confidence interval; BMI = body mass index; CKD = chronic kidney disease; DKD = diabetic kidney disease;
HR = hazard ratio; HTN = hypertensive nephropathy; MET-h/day = metabolic equivalent of task hours per day.TaggedAPTARAEnd