Page 92 - 《水产学报》2026年第3期
P. 92

3 期                                     水    产    学    报                                 50 卷


                                                  表 4    指标可信度分析结果
                                             Tab. 4    Reliability index analysis results
                                            项目                                克伦巴赫α系数 样本数量/项        排除项
                                            items                              Cronbach's α sample quantityexclusion items
              压力与支撑力评价指标体系 evaluation index system for pressure and support force  0.945    17        0
              破坏力与恢复力评价指标体系 evaluation index system for destructive force and resilience  0.917  8    0
              退化力与提升力评价指标体系 evaluation index system for degradation and enhancement capabilities  0.908  11  0


                                             表 5    山东省海洋资源环境承载力状况
                         Tab. 5    The carrying status of the marine resources and environment in Shandong Province
               年份   压力     支撑力        破坏力      恢复力       退化力     提升力       承载力状态值            各作用力均值
               year pressure supporting force destructive power resilience degenerative force  lift  bearing capacity state value mean values of various forces
               2012  1.103  1.041      1.719    0.890    1.299    0.671      0.631              1.120
               2013  1.281  0.934      1.041    0.929    1.062    0.735      0.768              0.997
               2014  1.352  1.143      1.153    1.025    1.061    0.856      0.848              1.098
               2015  1.262  1.348      1.140    0.919    1.196    0.909      0.883              1.129
               2016  1.091  1.307      1.158    0.919    1.137    0.941      0.935              1.092
               2017  0.889  1.302      1.135    1.092    0.843    0.992      1.181              1.042
               2018  0.845  1.217      1.143    1.092    1.140    1.210      1.125              1.108
               2019  0.834  1.033      1.429    1.116    1.600    1.427      0.926              1.240
               2020  0.970  0.889      0.875    1.218    1.843    1.615      1.009              1.235


                           承载力状态值        各作用力均值                        2.0    破坏力          恢复力
                     1.4   capacity state value  mean contribution value  1.8  destructive force  resilience force
                     1.2                                               1.6
                                                                       1.4
                  作用力数值  value of force  0.8                      作用力贡献值 contribution value of  acting force  1.0
                     1.0
                                                                       1.2
                                                                       0.8
                     0.6
                                                                       0.6
                     0.4
                                                                       0.4
                     0.2
                       0                                               0.2 0
                         2012 20132014 2015 2016 2017 2018 20192020       20122013 20142015 2016 2017 2018 2019 2020
                                       年份                                               年份
                                       year                                             year
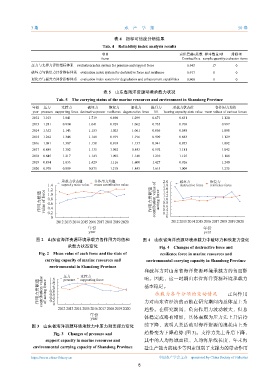
                图 2    山东省海洋资源环境承载力各作用力均值和                    图 4    山东省海洋资源环境承载力中破坏力和恢复力变化
                              承载力状态变化                                Fig. 4 Changes of destructive force and
                  Fig. 2 Mean value of each force and the state of   resilience force in marine resources and
                    carrying capacity of marine resources and  environmental carrying capacity in Shandong Province
                      environmental in Shandong Province
                                                               和破坏力对山东省海洋资源环境承载力的负面影
                      1.6   压力     支撑力                         响。因此,这一时期山东省海洋资源环境承载力
                            pressure
                                   supporting force
                 作用力贡献值  contribution value  of acting force  1.2  基本稳定。
                      1.4
                      1.0
                      0.8
                      0.6
                                                                    承载力各个分项的变动情况  正向作用
                      0.4
                      0.2
                        0
                          2012 20132014 2015 2016 2017 2018 20192020  力对山东省经济的贡献在研究期间内总体呈上升
                                                               趋势。在研究期间,负向作用力波动较大,但总
                                       年份                      体稳定或略有增加,具体表现为压力先上升后持
                                        year
               图 3    山东省海洋资源环境承载力中压力和支撑力变化                    续下降,表明人类活动对海洋资源的消耗由上升
                        Fig. 3 Changes of pressure and         趋势变为下降趋势         (图  3)。支撑力先上升后下降,
                    support capacity in marine resources and   其中的人均海域面积、人均海岸线长度、年末海
               environmental carrying capacity of Shandong Province  盐生产能力的减少等因素削弱了支撑力的带动作用

              https://www.china-fishery.cn                           中国水产学会主办    sponsored by China Society of Fisheries
                                                            8
   87   88   89   90   91   92   93   94   95   96   97