
Page 81 - 《水产学报》2026年第3期
P. 81
3 期 唐 馨,等:基于最新数据的西北太平洋柔鱼资源评估 50 卷
1.0
2.5 JABBA JABBA
0.8
2.0
1.5 0.6
B/B MSY 1.0 F/F MSY 0.4
0.5 0.2
0 0
1995 2000 2005 2010 2015 2020 1995 2000 2005 2010 2015 2020
年份 年份
year year
(a) (b)
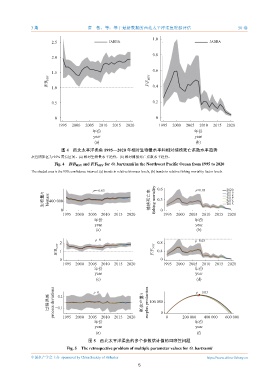
图 4 西北太平洋柔鱼 1995—2020 年相对生物量水平和相对捕捞死亡系数水平趋势
灰色阴影区为 95% 置信区间。(a) 相对生物量水平趋势,(b) 相对捕捞死亡系数水平趋势。
Fig. 4 B/B MSY and F/F MSY for O. bartramii in the Northwest Pacific Ocean from 1995 to 2020
The shaded area is the 95% confidence interval. (a) trends in relative biomass levels, (b) trends in relative fishing mortality factor levels.
ρ=−0.03 0.6 ρ=0.03 2020
2019
生物量/t bionass 400 000 捕捞死亡率 fishing mortality 0.3 2017
2018
2016
2015
0 0
1995 2000 2005 2010 2015 2020 1995 2000 2005 2010 2015 2020
年份 年份
year year
(a) (b)
ρ=0 ρ=0.03
2 0.8
B/B MSY 1 F/F MSY 0.4
0 0
1995 2000 2005 2010 2015 2020 1995 2000 2005 2010 2015 2020
年份 年份
year year
(c) (d)
0.1
过程误差 process deviations −0.1 ρ=0 剩余产量/t surplus production 100 000 0 ρ=−0.03
2005
1995
2000
年份 2010 2015 2020 0 200 000 年份 400 000 600 000
year year
(e) (f)
图 5 西北太平洋柔鱼的多个参数估计值的回顾性问题
Fig. 5 The retrospective problem of multiple parameter values for O. bartramii
中国水产学会主办 sponsored by China Society of Fisheries https://www.china-fishery.cn
5