Page 86 - 《水产学报》2026年第2期
P. 86

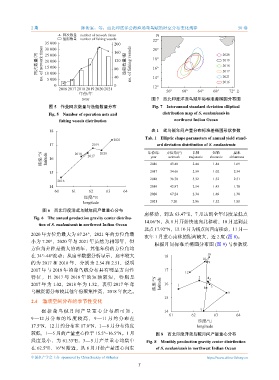
2 期                   陈俊霖,等:西北印度洋公海渔场鸢乌贼的时空分布变化规律                                        50 卷

                            网次数量 number of network times            N
                            渔船数量 number of fishing vessels        22°
                    35 000                        200             20°
                    30 000
                                                  160
                 网次数量/网  no. of network times  25 000  120  渔船数量/艘  no. of fishing vessels  18°  2020
                                                                                                2019
                    20 000
                                                                                                2018
                    15 000
                                                                  16°
                                                  80
                                                                                                2017
                    10 000
                                                                                                2021
                                                  40
                                                                  14°
                     5 000
                                                                                                2016
                        0                         0               12°
                          2016 2017 2018 2019 2020 2021                 56°    60°   64°    68°    72° E
                                   年份/年
                                    year                          图 7    西北印度洋鸢乌贼年际标准差椭圆分布图
                      图 5    作业网次数量与渔船数量分布                        Fig. 7 Interannual standard deviation elliptical
                      Fig. 5 Number of operation nets and             distribution map of S. oualaniensis in
                          fishing vessels distribution                     northwest Indian Ocean


                      18                                          表 1    鸢乌贼年间产量分布标准差椭圆形状参数
                                                               Tab. 1    Elliptic shape parameters of annual yield stand-
                                                 2021
                      17                2019                        ard deviation distribution of S. oualaniensis
                                                                                            短轴
                                                                                                     扁率
                                                                                   长轴
                   纬度/°N  latitude  16  2018  2017  2020        年份/年    方位角/(°)   majoraxis  shortaxis  oblateness
                                                                 year
                                                                         azimuth
                                                                 2016
                                                                                   2.44
                                                                                                     1.69
                                                                                            1.44
                                                                          43.40
                      15                                         2017     34.66    2.59     1.02     2.54
                                                                 2018     36.70    3.32     1.32     2.51
                          2016
                      14                                         2019     42.97    2.54     1.43     1.78
                        60      61     62     63      64
                                                                 2020     67.24    2.34     1.69     1.38
                                     经度/°E
                                    longitude                    2021     7.20     2.86     1.52     1.88
                   图 6    西北印度洋鸢乌贼年间产量重心分布
                                                               南移动,到达       63.47°E,7  月达到全年纬度最低点
               Fig. 6 The annual production gravity center distribu-
                                                               14.06°N,从  8  月开始快速向北移动,10         月达到最
                  tion of S. oualaniensis in northwest Indian Ocean
                                                               北点  17.92°N,以  10  月为拐点向西南移动,11         月—
              2020  年方位角最大为       67.24°,2021  年的方位角最
                                                               次年  1  月重心南移的距离较大,近            2  度  (图  8)。
              小为   7.20°,2020  年与  2021  年虽然为相邻年,但
                                                                   根据月间标准差椭圆分布图              (图  9) 与参数统
              方位角差距是最大的两年,其他年份的方位角均

              在  34°~44°波动;从扁率数据分析显示,扁率较大                              18                10
                                                                                       11
              的为   2017  和  2018  年,分别为   2.54  和  2.51,说明                                9
              2017  年与  2018  年的鸢乌贼分布具有明显方向性                           17
                                                                                12
              特征,且      2017  与  2018  年的短轴较短,特别是                                     2  4 5
              2017  年为  1.02,2018  年为  1.32,表明   2017  年鸢          纬度/°N  latitude  16  1  8  3
              乌贼资源分布较其他年份聚集性高,2018                 年次之。                                           6
                                                                       15
               2.4    渔场空间分布的季节性变化
                   根 据 鸢 乌 贼 月 间 产 量 重 心 分 布 图 可 知 ,                   14             7
                                                                         61        62       63        64
              9 —12 月 分 布 的 纬 度 较 高 , 9 —11 月 约 分 布 在
                                                                                     经度/°E
              17.5°N,12  月约分布在      17.0°N,1—8  月分布纬度                                longitude
              较低,1—5     月的产量重心位于         15.5°~16.5°N。1  月        图 8    西北印度洋鸢乌贼月间产量重心分布
              经度最小,为        61.33°E,3—5  月产量重心均集中              Fig. 8 Monthly production gravity center distribution
              在  62.5°E、16°N  附近,从    6  月开始产量重心向东                  of S. oualaniensis in northwest Indian Ocean

              中国水产学会主办  sponsored by China Society of Fisheries                          https://www.china-fishery.cn
                                                            7
   81   82   83   84   85   86   87   88   89   90   91