
Page 82 - 《水产学报》2025年第8期
P. 82
王一航,等 水产学报, 2025, 49(8): 089307
0.6 5
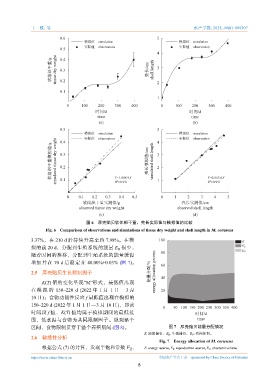
模拟值 simulation 模拟值 simulation
实际值 observation 实际值 observation
0.5
4
软组织干重/g tissue dry weight 0.3 壳长/cm shell length 3
0.4
0.2
0.1 2
1
0 100 200 300 400 0 100 200 300 400
时间/d 时间/d
time time
(a) (b)
0.5 5
模拟值 simulation 4 模拟值 simulation
实际值 observation
实际值 observation
0.4
软组织干重模拟值/g simulated tissue dry weight 0.3 Y=1.088 9X 壳长模拟值/cm simulated shell length 3 Y=0.965 0X
0.2
2
0.1
2
2
0 0.1 0.2 0.3 R =0.991 0.5 1 0 1 2 3 R =0.991 5
4
0.4
软组织干重实测值/g 壳长实测值/cm
observed tissue dry weight observed shell length
(c) (d)
图 6 厚壳贻贝软体部干重、壳长实际值与模拟值的比较
Fig. 6 Comparison of observations and simulations of tissue dry weight and shell length in M. coruscus
3.37%,在 210 d 后持续升高至约 7.98%。在模 100 E
拟的前 20 d,分配到生殖系统的能量 E 很少, E R
R
随着时间的推移,分配到生殖系统的能量缓慢 80 E V
增加并在 70 d 后稳定在 40.00%±0.03% (图 7)。 60
2.5 厚壳贻贝生长限制因子 能量分配/% energy allocation percent
K(T) 值的变化呈现“M”形式,最低值出现 40
在 模 拟 的 150~220 d (2022 年 1 月 1 日 — 3 月 20
10 日);食物功能性反应 f 最低值出现在模拟的
150~220 d (2022 年 1 月 1 日—3 月 10 日),即该
0 50 100 150 200 250 300 350 400
时间段 f 值、K(T) 值均属于模拟期间的最低范 时间/d
围,低水温与食物为共同限制因子。纵观整个 time
区间,食物限制贯穿于整个养殖期间 (图 8)。 图 7 厚壳贻贝能量分配情况
E. 能量储备,E R . 生殖储备,E V . 结构体积。
2.6 敏感性分析
Fig. 7 Energy allocation of M. coruscus
根据公式 (7) 的计算,发现半饱和常数 F 、 E. energy reserve, E R . reproductive reserve, E V . structural volume.
H
https://www.china-fishery.cn 中国水产学会主办 sponsored by China Society of Fisheries
8